EURUSD - Higher Time Frame Bullish BiasHigher time frame remains bullish, even though lower time frame structure may appear bearish at first glance.
After price broke a higher time frame high, it began to rotate back into a mid-term range. That initial downside move looked like bearish continuation, but in context, it acted more as inducement—sweeping internal liquidity before price delivered into a higher time frame auction area (demand zone).
From that mitigation, price reacted and shifted mid-term structure, briefly breaking highs and showing bullish continuation, although without fully expanding beyond the higher time frame highs.
Price then formed a stronger mid-term high and retraced again, taking out internal liquidity and engineering further inducement before returning into a key Point of Interest (orange zone). This level aligned with a higher time frame liquidity area and previously marked demand.
After mitigation, price once again shifted mid-term structure, breaking minor lower highs and forming a new internal bullish leg. This reinforces the idea that the broader higher time frame bullish structure is still intact.
From here, the expectation is for price to first target internal mid-term liquidity and inducement levels before potentially rotating into the orange POI below for another mitigation phase.
If that occurs, I will look for lower time frame confirmation (break of minor structure) to support continuation toward higher time frame highs and mid-term highs.
Until then, I remain patient. No anticipation—only reaction to structure and liquidity delivery.
Patience builds clarity. Structure confirms intent. Follow the footprint, not the noise.
Multiple Time Frame Analysis
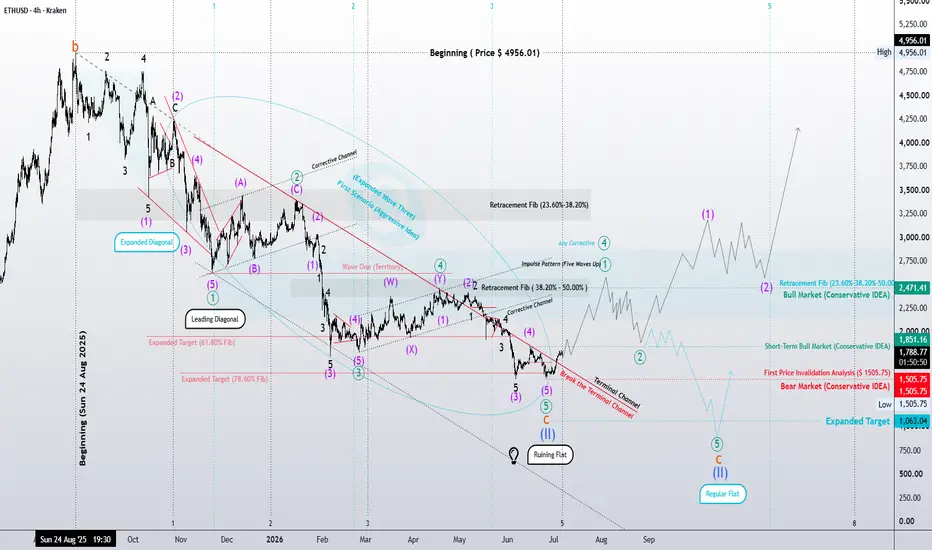
Ethereum 4H: Final Leg of a Larger Correction ?Ethereum 4H: Final Leg of a Larger Correction or the Beginning of the Next Bull Cycle? | Elliott Wave Analysis
Following the primary scenarios discussed on the daily chart, the 4-hour timeframe provides additional insight into the internal structure of Ethereum's ongoing correction.
From the conservative perspective, the decline labeled as wave C continues to display the characteristics of an impulsive structure. Most notably, the initial phase of this decline appears to have developed as a large Leading Diagonal, a pattern frequently observed at the beginning of major impulsive sequences.
A closer examination of the internal subdivisions reveals that the extensions of waves (3) and (5) have remained within the 61.8% to 78.6% Fibonacci extension range, a behavior commonly associated with the personality of leading waves within larger impulsive structures.
There is also the possibility that the highlighted turquoise structure represents an extended third wave sequence. If the current interpretation is correct and the present decline is identified as wave (1) of a larger bearish impulse, then the market may still require one additional downward leg before the larger corrective structure is completed.
Under this interpretation, the Running Flat structure identified on the daily chart could eventually evolve into a Regular Flat, implying that Ethereum may still need to revisit lower price levels, potentially toward the $1,000-$900 region, before the larger bullish cycle begins.
However, an alternative outcome must also be considered.
If the current low marks the completion of the larger correction and the market develops a clear five-wave impulsive advance, the next expectation would be a corrective retracement against that advance. In this case, a decisive break above the wave (4) territory of the previous wave C decline would provide the first meaningful confirmation that the larger bullish cycle has begun.
Until such confirmation occurs, every corrective formation that develops following an initial advance—whether simple or complex, shallow or deep—must be evaluated carefully, as it may reinforce the possibility that one final bearish expansion remains ahead.
At present, the structure continues to respect Elliott Wave rules and guidelines. Therefore, the question is not whether Ethereum will eventually enter a major bull market, but whether the market has already completed its correction—or whether one final decline is still required before that expansion begins.
Sometimes the market's final test appears just before its greatest opportunity.
– Patterns whisper. I listen. – Mr. Nobody 🎧📊
Ethereum
2 days ago
Running Flat Correction Before a Historic Expansion? Ethereum!
EURGBP- Bearish OutlookHigher time frame is showing a bearish mapping, with price currently taking out downside liquidity.
What I’m watching for next is a potential run into buy-side liquidity first—specifically a sweep of mid-term internal highs into the higher time frame supply / auction areas above.
If that expansion into buy-side liquidity happens, I’ll then look for confirmation on the lower time frame: a break of the minor higher low, signaling a shift back in alignment with bearish structure and footprints.
That shift would open the path for continuation lower, targeting mid-term lows and eventually higher time frame lows.
Until then, I’m sitting on my hands. No anticipation—only reaction to what price confirms.
Track structure, follow liquidity, stay patient
Long trade
Pair: DXY
Direction: 🟢 Buyside Trade Idea
Date: Thu 2nd July 2026
Session: NY Session AM
Entry Time: 8:50 AM
Execution Timeframe: 15 minutes
Entry: 100.336
Profit Level: 100.989 (+0.65%)
Stop Level: 100.293 (-0.043%)
Risk-to-Reward Ratio: 15.9
🟢 Bias: Strong Buyside
Following a failed London continuation lower, DXY engineered a deep sell-side liquidity sweep beneath 100.30. The rejection was immediate, producing a bullish Change of Character (CHOCH) and reclaiming the London range.
The market transitioned from discount pricing into expansion, shifting the institutional liquidity draw toward 100.989.
Asia established an equilibrium
→ London raided sell-side liquidity
→ Discount pricing reached
→ Strong bullish displacement developed
→ CHOCH confirmed
→ Bullish BOS reclaimed structure
→ New York continued higher
→ Premium liquidity targeted at 100.989
🌍 Macro & News Narrative
🇺🇸 Federal Reserve
The US Dollar remains highly sensitive to changes in expectations around Federal Reserve policy. Markets continue to price each major inflation, employment, and growth release for clues about future interest-rate decisions.
Any data supporting higher-for-longer rates tends to strengthen the Dollar by increasing the relative attractiveness of USD-denominated assets.
Journal Summary
DXY delivered a textbook London-to-New York liquidity reversal after sweeping sell-side liquidity below 100.30 and reclaiming bullish market structure. The long entry at 100.336 targeted 100.989. Boosting 15.9RR, supported by Federal Reserve expectations, resilient Treasury yields, safe-haven USD demand, and strong inverse correlation with Gold's simultaneous premium rejection.
GBPJPY (GJ) - higher Time Frame OutlookAfter remapping and reassessing the higher time frame structure for the week, price has broken above a major higher time frame high, confirming strong bullish momentum.
Although price may continue pushing higher, I’m now watching for signs of exhaustion. My primary expectation is for price to first take out the internal mid-term liquidity before delivering into the auction area—my higher time frame Point of Interest (orange zone).
If price reaches that POI, I’ll shift my attention to the lower time frames, looking for confirmation through a break of the minor lower high. That structural shift would signal that buyers have regained control and that the bullish trend has been confirmed.
From there, I’ll be tracking price for another engineered internal liquidity leg into discounted territory before targeting the next higher time frame mid-term highs.
Until then, I’m staying patient. There’s no need to anticipate what price hasn’t confirmed yet.
Patience is key. Tracking remains the edge—let price reveal its intent, then execute with conviction.
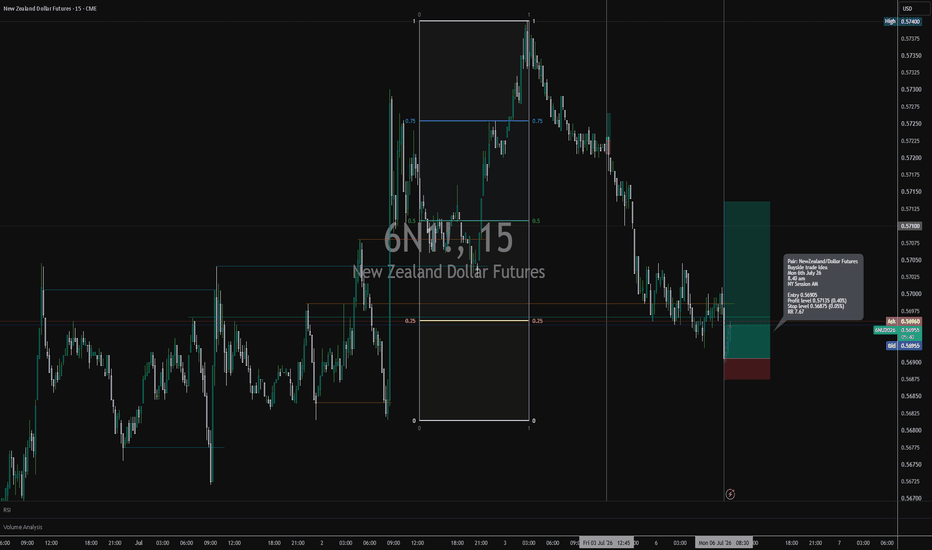
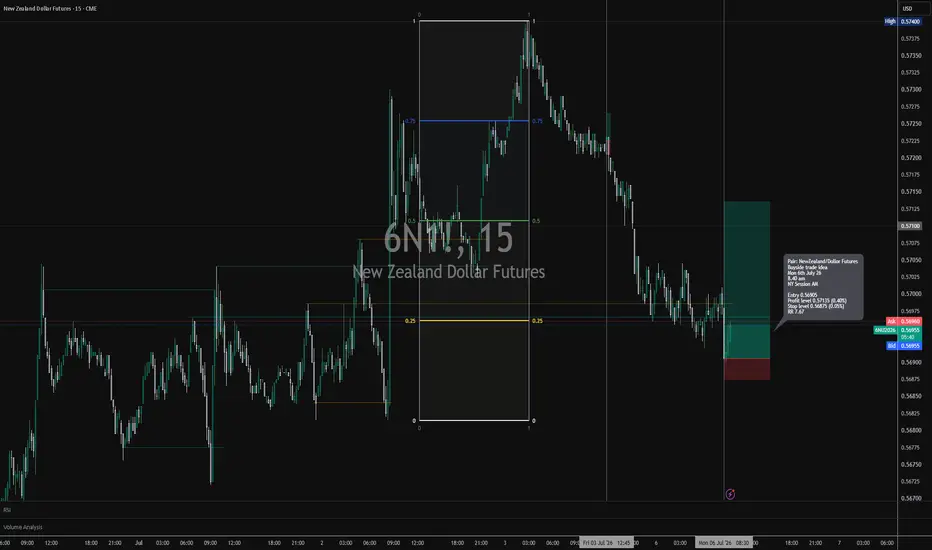
Long trade
Pair: 6N1! (New Zealand Dollar Futures)
Direction: 🟢 Buyside Trade Idea
Date: Mon 6th July 2026
Session: NY Session AM
Entry Time: 8:40 AM
Execution Timeframe: 15 minutes
Entry: 0.56905
Profit Level: 0.57135 (+0.40%)
Stop Level: 0.56875 (-0.05%)
Risk-to-Reward Ratio: 7.67
🟢 Bias: Buyside
Following several sessions of decline, price completed a sell-side liquidity sweep beneath the intraday support around 0.5690 before finding buyers in a discount zone. The rejection from the lows created a bullish Change of Character (CHOCH), reclaiming short-term market structure and signalling the beginning of an intraday recovery.
The institutional objective is a rotation back toward the premium side of the range, targeting 0.57135.
Previous sessions distributed lower
→ Sell-side liquidity swept beneath support
→ Discount pricing reached
→ Strong bullish rejection developed
→ Bullish CHOCH confirmed
→ Internal BOS reclaimed
→ Entry triggered at 0.56905
→ Buy-side liquidity targeted at 0.57135
🌍 Macro & News Narrative
🇳🇿 Reserve Bank of New Zealand (RBNZ)
The New Zealand Dollar remains heavily influenced by expectations for RBNZ monetary policy. Markets continue to assess whether inflation is easing enough to justify additional policy adjustments. Any signs that rates may remain relatively supportive can strengthen NZD.
🇺🇸 US Dollar Outlook
Because NZD/USD is highly sensitive to the US Dollar, any broad USD weakness—driven by softer Treasury yields or reduced expectations for tighter Federal Reserve policy—can support NZD strength.
If DXY weakens after failing to hold recent gains, NZD futures typically benefit.
USDJPY (U) - Higher Time Frame Bullish OutlookThe 4H higher time frame remains bullish.
Studying price, I noticed it first took out the previous mid-term lows before engineering liquidity and delivering into the mid-term Point of Interest (orange zone). That liquidity event provided the fuel for price to trade into a higher time frame area of interest.
At the POI, price responded with a strong wick rejection rather than full acceptance, suggesting a reaction from buyers instead of sustained selling pressure.
From that reaction, price lifted off the bullish POI and began rebalancing the previous bearish inefficiency. Based on previous observations, price could still revisit the orange POI for deeper higher time frame acceptance through candle-body closes before continuing higher.
For now, I’m treating the current mid-term high and mid-term low as the operating range. As long as price remains within that range, I’m focused on observing rather than anticipating.
If bullish momentum expands and price takes out the current mid-term highs, I’ll reassess the newly engineered liquidity and identify the next objective for continuation.
Until then, patience remains the priority. Tracking structure is still the edge—I’ll let price reveal its intent before committing to the next move.
Patience is key. Track the structure, trust the process, and let price do the talking.
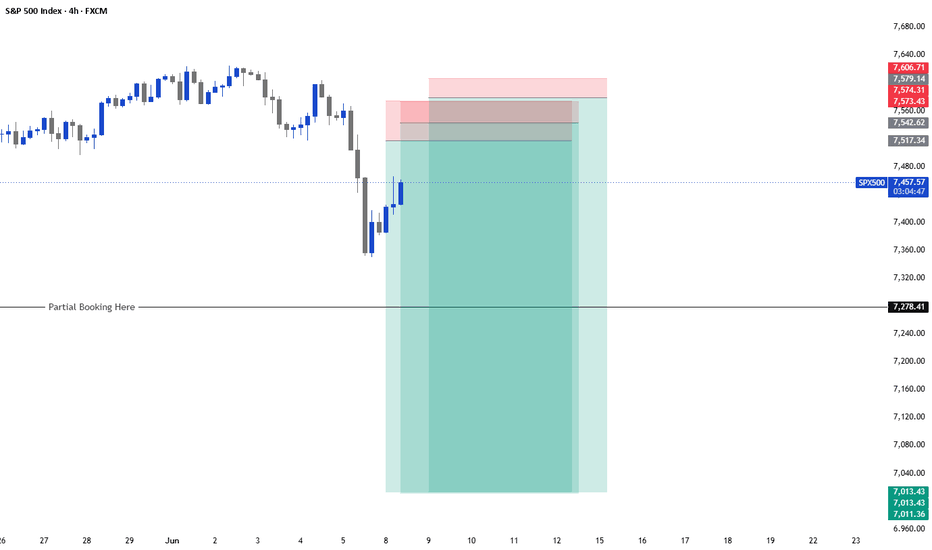
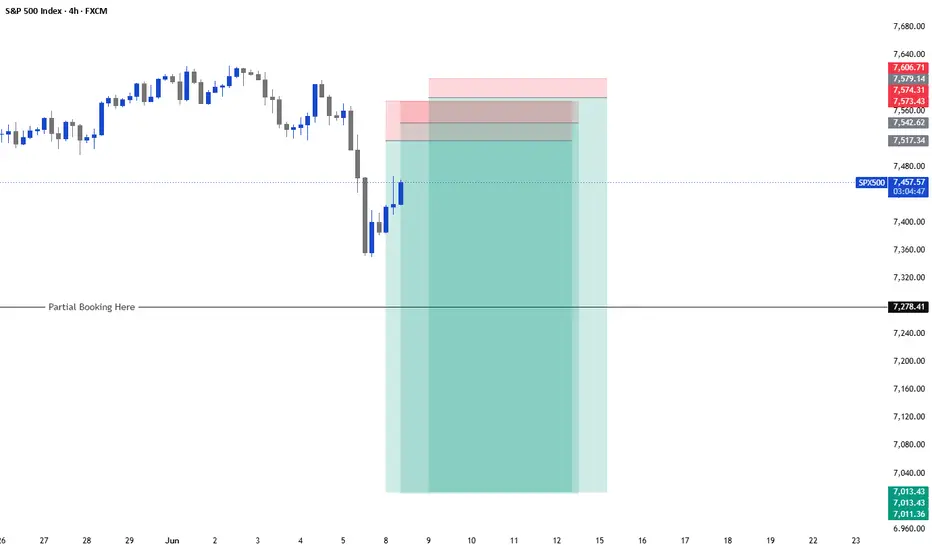
SPX500 Swing Sell / Short SetupNo Pullback, or any Bearish confirmation yet, just a Single candle engulfing (No VSA sign), but these areas are the demand zone where price can reach sooner or later.. That's a counter trade setup so use less amount, best of luck, if sl hits and needs to re-enter will tell you.
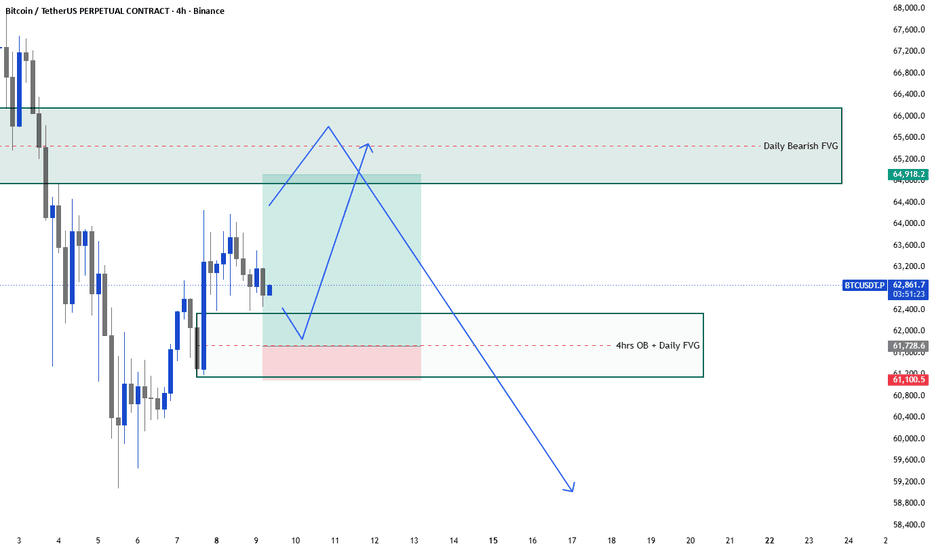
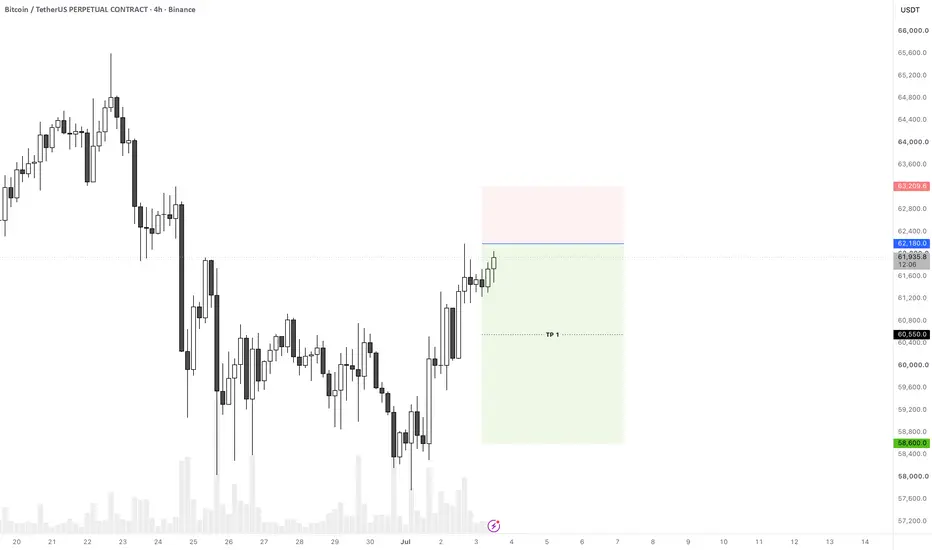
BTCUSDT.P Swing Buy / Long SetupNot an A+ setup, but good setup will be shared after weekly closing, so we can decide the target, for now we have daily bearish fvg pending so btc can go up to fill price imbalance, although price action is bearish, but will not look for short from here until we get a weekly closing. Must use SL, don't hold for so long. Best Of Luck!
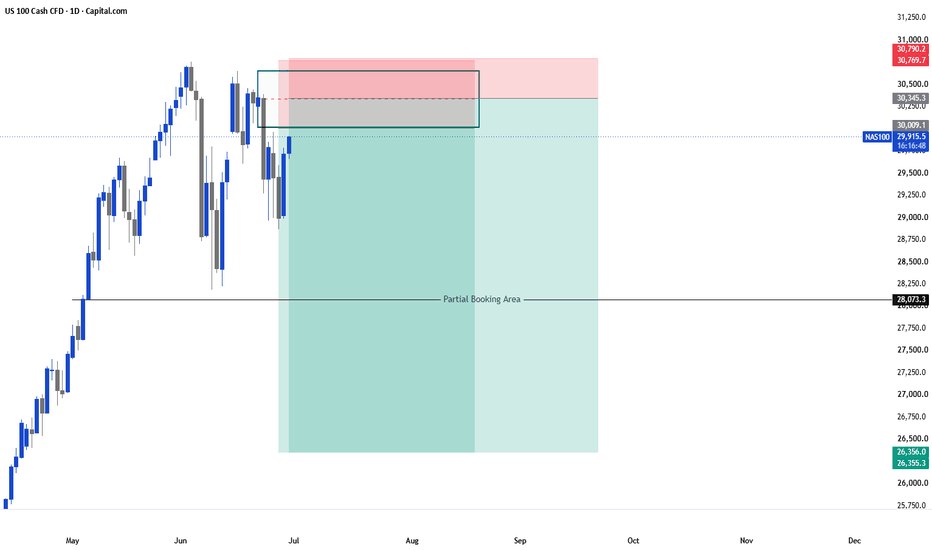
Nas100 Ustec Swing Sell / Short SetupNas100 / USTec has reached a level where Buyers are exhausting soon it will take correction on monthly levels, So be careful on buying, although trend is bullish there is no confirmation of bearish trend, but taking aggressive entries Risk to Reward is very high on Sell, market may sweep ath, trap buyers and then dumps, will look only sell setups on US500 and US100. Best Of Luck!
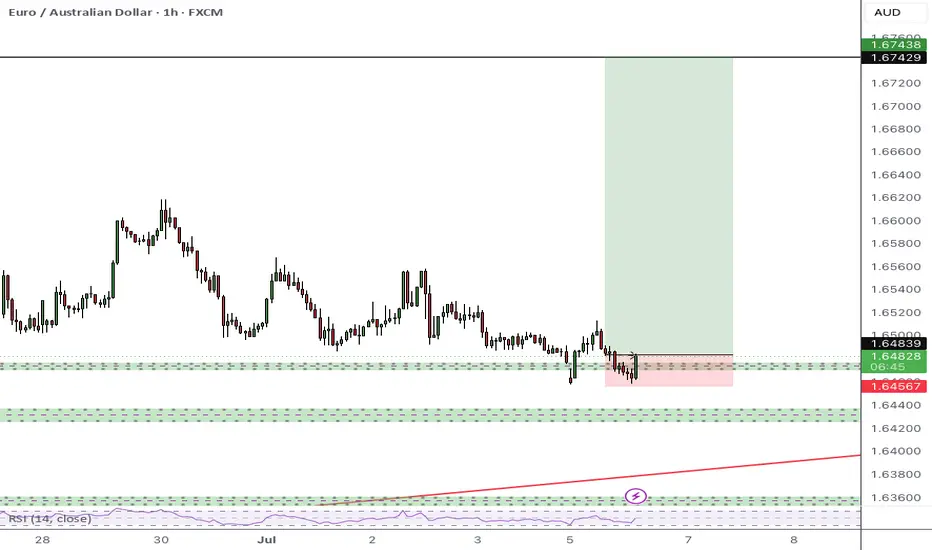
BTCUSDT Short setupHey everyone.
This area is our daily OB and I've set an limit order for this setup but as always the best practice is to wait for the confirmation and that means to wait for CHoCH in lower TF and then find a good opportunity to enter.
Entry: 62180
SL: 63210
TP1: 60550 (1:1.6RR)
TP2: 58600 (1:3.5RR)
Goodluck.
Dear traders, please support my ideas with your likes and comments to motivate me to publish more signals and analysis for you.
Best Regards
Navid Nazarian
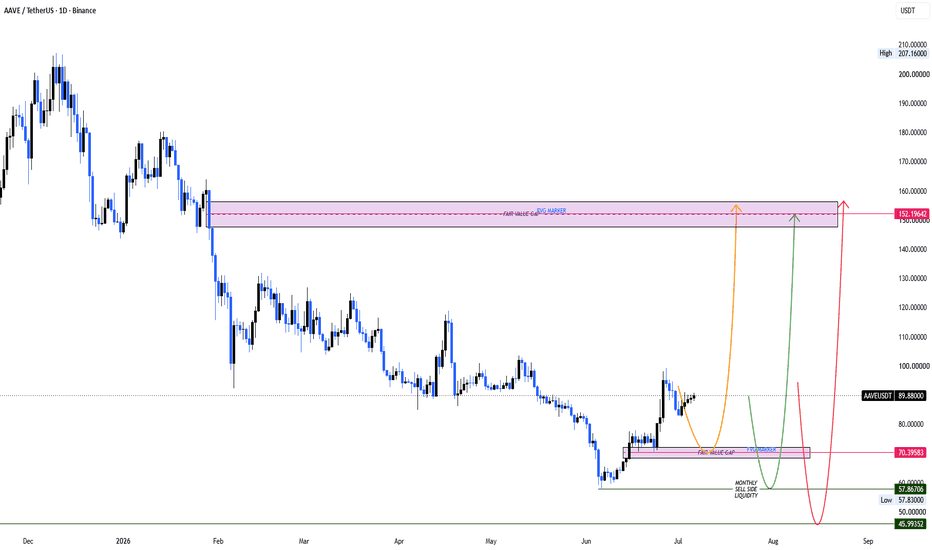
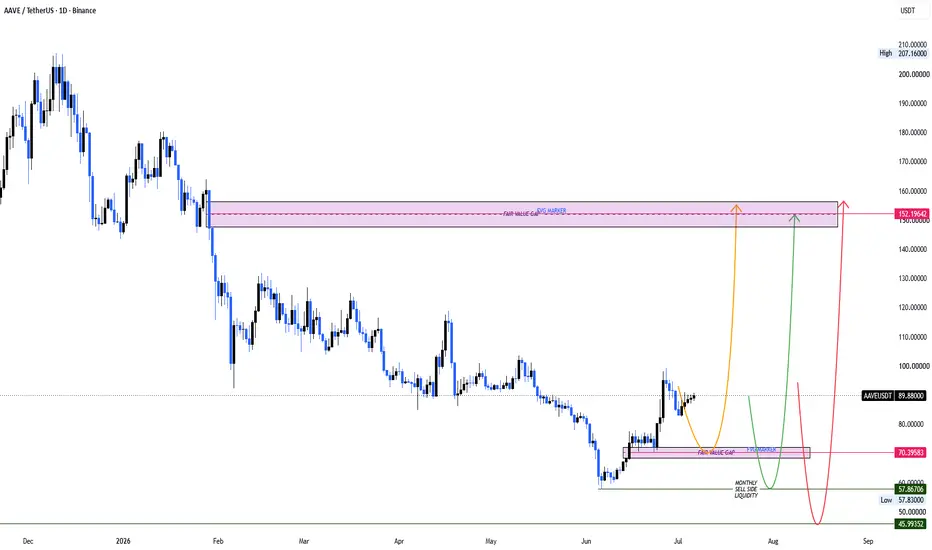
AAVEUSDT LONGThe broader bias across the crypto market remains to be bearish. In the short term, price indicates there is resistance to prevent further price collapse. On the daily charts, price has shifted from a bearish to bullish price structure informing our bias to seek buy limit orders. We have three entry points;
FVG 70.395
Monthly SSL1-57.87
Monthly SSL2-46
The take profit is the daily FVG 152.1
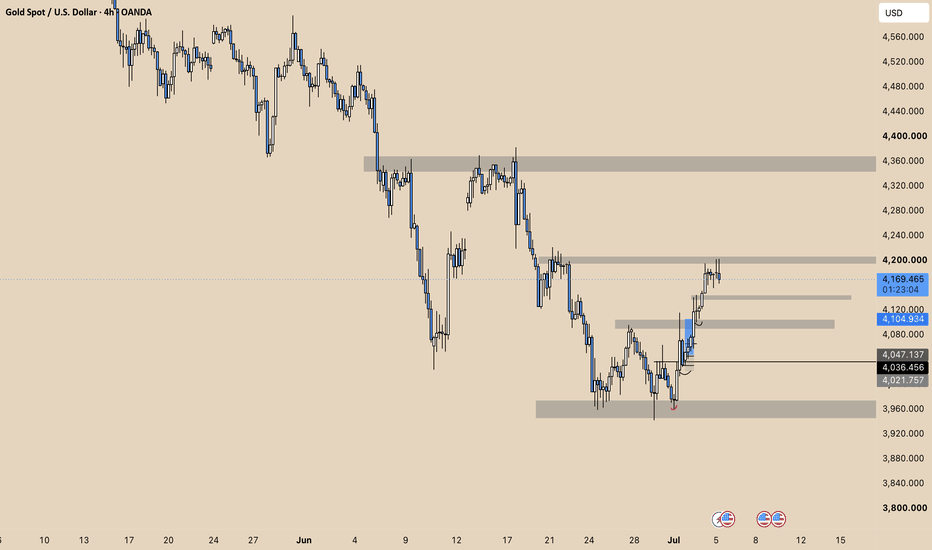
XAU/USD 06 July 2026 Intraday AnalysisH4 Analysis:
-> Swing: Bullish.
-> Internal: Bearish.
Bias and analysis to remain the same as analysis dated 30 June 2026.
Price did not print bullish CHoCH to indicate bullish pullback phase initiation. Price instead printed a new low followed by a bullish CHoCH
Price is currently trading within and established internal range, however, I will continue to monitor price with respect to depth of pullback.
Intraday expectation:
Price to trade up to either premium of internal 50% EQ, or H4 demand zone before targeting weak internal low, currently priced at 3,942.100.
Note:
Gold remains volatile as tensions between the US, Israel, and Iran keep safe‑haven demand elevated.
Markets are reacting quickly to every headline, while uncertainty around the Fed’s easing path and shifting U.S. policy under President Trump, especially tariffs continues to fuel choppy price action.
For newer traders, the key is simple, stay flexible and manage risk carefully, as fast spikes and sudden reversals are a normal part of the current XAU/USD environment.
H4 Chart:
M15 Analysis:
-> Swing: Bearish.
-> Internal: Bullish.
Price previously did not print a bearish CHoCH and continued bullish.
Price subsequently printed a bearish CHoCH to indicate bearish pullback phase initiation.
Price is currently trading within an established internal range, however, I shall monitor price with respect to depth of pullback.
Intraday expectation:
Price to trade down to either discount of internal 50% EQ, or M15 supply zone before targeting weak internal high, priced at 4,195.510. Price may potentially print higher to bring CHoCH positioning closer to recent price action
Note:
Gold remains highly reactive on M15 as geopolitical risk continues to drive quick, headline‑led moves.
The tension between the US, Israel, and Iran is keeping safe‑haven demand elevated, with markets still sensitive to any sign of escalation.
At the same time, shifting US tariff policy under President Trump is adding extra uncertainty, fuelling sharp intraday swings and increasing the likelihood of sudden sentiment flips. Liquidity pockets and whipsaws remain common, making disciplined risk management essential.
Gold’s geopolitical premium is still firmly in place, and until tensions ease, short‑term volatility is likely to stay front‑loaded.
M15 Chart:
CRT Provides the Context. SMC Povides the ExecutionA Confirmation-Based Execution Framework
One of the biggest shifts in my trading wasn’t discovering another pattern.
It was changing when I decided to participate.
For a long time, I treated CRT as an entry model.
Now I treat it as a confirmation framework that guides my Smart Money Concepts execution.
That single adjustment has completely changed the way I approach the market.
⸻
The Mistake I Was Making
When price swept liquidity, I immediately started looking for an entry.
Sometimes it worked.
Sometimes it didn’t.
What I eventually realized was this:
A liquidity event alone does not automatically confirm directional intent.
It simply tells me that liquidity has been accessed.
The market still has to prove what it wants to do next.
That realization taught me the value of patience.
⸻
Candle One Creates My Framework
Everything begins with Candle One.
I mark its range.
• High
• Low
Nothing else.
At this stage, I have no bias based solely on the pattern.
I’m simply identifying the area where I expect the market to reveal information.
Think of Candle One as the map—not the destination.
⸻
Liquidity Is Information, Not an Entry
This was another major realization.
Many traders see a liquidity sweep and immediately assume continuation.
I no longer view it that way.
A wick beyond the range only tells me one thing:
Liquidity has been interacted with.
It does not automatically confirm acceptance in that direction.
That distinction changed my execution.
⸻
My Confirmation Rule
This is the rule that now defines my execution model.
After liquidity is taken, I wait.
Whether I’m using a two-candle or three-candle CRT framework, I want to see a candle body close beyond Candle One’s range before I begin looking for entries.
For me, that body close represents stronger confirmation than a wick alone.
It tells me the market has shown greater commitment before I risk capital.
This isn’t about predicting.
It’s about allowing the market to reveal intent.
⸻
Where Smart Money Concepts Takes Over
Once higher-timeframe confirmation is established, CRT has done its job.
Now my execution begins.
I shift to the lower timeframe and begin searching for:
• Liquidity sweeps
• Market Structure Shift (CHoCH)
• Displacement
• Order Block mitigation
• Precise execution
CRT provides my higher-timeframe confirmation.
SMC provides my lower-timeframe precision.
The two work together—not separately.
⸻
Why This Changed My Trading
The biggest improvement wasn’t finding more setups.
It was filtering out unnecessary ones.
Waiting for confirmation forces patience.
Patience improves decision-making.
Better decisions improve consistency.
The market will always create another opportunity.
My job is simply to wait until the odds improve.
⸻
Final Thoughts
This isn’t presented as the only way to interpret CRT.
It’s simply the confirmation-based execution framework that has improved my decision-making.
Every trader develops rules that fit their personality.
This is one of mine.
I no longer rush to participate because liquidity has been taken.
I wait for the market to confirm its intent.
Then I allow Smart Money Concepts to refine the execution.
CRT provides the context.
SMC provides the execution.
And for me, that distinction has made all the difference.