EUR/USD 4H | A Rally, or One More Decline Before the Structure CReading time: ~3 minutes
We Follow Structure, Not Predictions
In market analysis, seeing an upward move is not enough to conclude that a larger bullish trend has begun. What matters is the internal structure of the move, its relationship to previous waves, and the evidence price provides as the pattern develops.
On the EUR/USD 4-hour chart, the current scenario considers the possibility that the corrective structure is approaching completion. However, the potential for a further decline remai
Multiple Time Frame Analysis
USD/CHF | Bullish Outlook— Tracking the Next ObjectiveThe bullish outlook remains intact following top-down confirmation of the trend. Last week presented a buy opportunity, and now the focus shifts to the next objective.
Price is currently interacting with the green accumulation/auction zone, where I'm monitoring the reaction. So far, bullish price action is showing up, while long-term momentum remains intact and supportive of the bullish narrative.
My next step is to wait for minor internal liquidity to be taken, followed by a clear bullish rea
EUR/USD | Bearish Bias, Conflicting Footprints
EUR/USD remains on my radar, but I'm seeing something worth watching closely.
Over the years, I've noticed that EUR/USD and GBP/USD often move in similar directions. However, GBP/USD is currently printing bullish structure while EUR/USD is developing a different structural picture. That contrast has my attention.
On EUR/USD, price has mitigated the mid-term auction zone (orange), followed by a lower-timeframe trend shift around the lower green zone, where the previous higher low was breached.
EUR/GBP | Tracking the Sequence — Waiting for ConfirmationPrice has completed a distribution phase following manipulation, building on the expansion that developed out of the previous accumulation.
From there, price reclaimed the higher-timeframe order block (blue zone), followed by a mid-term structural shift at the orange level, breaking the previous lower high.
Price then pulled back, swept the internal leg and inducement to confirm the high, and mitigated the refined mid-term order block — the thin orange zone price is currently hovering around.
EUR/USD|When Three Waves Become Five: Reading the Market Puzzle Reading time: Approximately 3 minutes
The key question in the daily EUR/USD chart is whether the current movement is simply part of a larger correction or whether the market is building a structure that could lead to a stronger bullish expansion.
To answer that question, we need to examine how the waves develop, how they relate to one another, and what the next price movement reveals. A three-wave move alone does not confirm that a correction is complete, nor does it guarantee the beginning of
CAD/JPY | Bullish Outlook — Tracking Its FootprintsStill holding this trade from previous weeks as price continues delivering in line with the bullish thesis.
Once price broke above the long-term moving average to the bullish side, we began seeing the delivery develop. Structure can establish the narrative, but momentum helps determine whether price has the backing to follow through.
Through top-down confirmation and mitigation, the bullish trend became increasingly aligned. The green levels represent lower-timeframe areas reacting within the
GBP/JPY | Bullish Outlook — Tracking Its FootprintsThe higher-timeframe outlook remains bullish. Price has mitigated the higher-timeframe zone marked in blue, far to the left, and has since been developing intermediate price action within the current mid-term range.
We're beginning to see bullish footprints forming toward the mid-term lower high, with momentum supporting the potential for further upside.
However, I'm not placing any buy points until the mid-term trend shift is confirmed. Potential continuation is one thing; confirmed structure
AUD/JPY | Bullish Outlook — Tracking Its FootprintsThe higher-timeframe outlook remains bullish. Within the blue zone, price delivered a mid-term trend change, breaking the institutional lower high and establishing a new high.
Following that shift, I waited for mid-term mitigation, then lower-timeframe bullish alignment. Price broke the minor lower high, and I began tracking the internal inducement sweep needed to confirm the high. Following mitigation and a bullish reaction, the trend alignment was established, and price delivered significant
USD/JPY | Higher-Timeframe Outlook — Tracking Its Footprints
Price remains bullish from a higher-timeframe perspective, and I’m still holding strong from last week, currently holding four positions and approaching five as I’ve added progressively while price develops in my favor.
As Jesse Livermore’s trading philosophy reminds us, the real money is often made by sitting tight and letting the market do its work. The challenge is staying convicted through the noise.
Price continues climbing toward the mid-term highs, printing higher lows along the way wh
GBP/USD | Weekly Outlook — Tracking Its FootprintsEarly-week update. The higher-timeframe perspective remains bullish, and the objective hasn’t changed from last week or the weeks prior.
Price has shown its hand through price action, breaking above a mid-term structural level — the previous lower high — and punching in a new high.
Now, I’m waiting for that high to be confirmed by taking out the near-term inducement sitting within the internal leg. Once that internal leg is taken and the essential liquidity is cleared, I’ll be looking for pric
AUDCHF 4H | FSSM Type 1 | Bearish Setup
AUDCHF is presenting a potential Fiblance Swing Structure Model (FSSM) Type 1 bearish setup.
Following a sharp bearish move from the marked higher-timeframe AOI, price is retracing towards the 50% level, presenting a potential continuation opportunity.
Bias: Bearish Primary Model: FSSM Type 1 Entry Zone: 0.5775–0.5780 Target: 0.5637 region Invalidation: Sustained acceptance above 0.5846
No confirmation = No trade.
PLAN YOUR TRADE | TRADE YOUR PLAN
Educational market analysis only. Not fina
NZDCHF 4H | FSSM Type 1 | Bearish SetupNZDCHF is presenting a potential Fiblance Swing Structure Model (FSSM) Type 1 bearish entry setup.
Following the 4H structural break, price has retraced into the marked resistance region. The current consolidation around the entry zone presents a potential opportunity for bearish continuation, subject to confirmation.
Bias: Bearish Primary Model: FSSM Type 1 Entry Zone: 0.4675–0.4679 Target: 0.4588 region Invalidation: Sustained acceptance above the marked bearish AOI (0.4724).
No confirmatio
GOLD: Massive Sellers Trap Ahead?Yello, Paradisers! Are #XAUUSDT sellers about to get trapped before a massive bullish move toward $4,300, or is the market preparing another dangerous liquidation event? The latest 4H price action is revealing something extremely interesting, and those who understand what is happening around the key support levels could have a significant advantage.
💎#XAUUSDT has just experienced an aggressive sell-off toward the $4,080 weekly support, followed by a strong bullish reaction. Interestingly, this
Bitcoin to $90k - February 2026Remember those dizzy heights seven days ago?
** The weeks ahead, void after May 2026 **
You read correctly, Without-worries has a bullish idea. For most of quarter 4, 2025 it has been a stream of bearish ideas, mostly all falling on deaf ears. Today is a bullish idea. A bullish idea with a time limit.
On the above 2 week chart we can see price action has collapsed 42% (The Answer to the Ultimate Question of Life, the Universe, and Everything) as retail traders provided the necessary exit liq
XAU/USD 19 October 2026 Intraday AnalysisH4 Analysis:
-> Swing: Bullish.
-> Internal: Bearish.
Bias and analysis to remain the same as analysis dated 30 June 2026.
Price did not print bullish CHoCH to indicate bullish pullback phase initiation. Price instead printed a new low followed by a bullish CHoCH
Price is currently trading within and established internal range, however, I will continue to monitor price with respect to depth of pullback.
Intraday expectation:
Price to trade up to either premium of internal 50% EQ, or
GBPJPY 4H: Will This Fresh Supply Zone Hold on a Retest?Symbol: GBPJPY
Timeframe: 4H (240M)
Market Structure: Rally-Base-Drop (RBD)
Zone Type: Fresh Supply Zone
Market Structure Analysis
GBPJPY is approaching a technically significant supply area on the 4-hour chart. This zone is being observed because it originated from a Rally-Base-Drop (RBD) structure, where price rallied into a basing area before a strong bearish departure.
The significance of this structure lies in the imbalance visible during the leg-out. A strong downward move away
Episode 12 — The Complete Market Cycle# 🎬 The Chronicles of Mr. Nobody
## Season I — The History of the Elliott Wave Principle
### Episode 12 — The Complete Market Cycle
⏱️ **Reading Time: 3 minutes**
In the previous episode, we explored how a motive wave can appear more complex than a simple five-wave pattern. We learned that understanding the market requires more than counting waves. We must also recognize where each wave fits within the larger structure.
But now, another question arises:
**If the market moves in five waves
DXY: Is the Dollar about to crash? – October 2026SYMBOL: TVC:DXY | DIRECTION: SHORT | TIMEFRAME: 23-Day
Published: October 2026
The dollar index is back at 101.78, inside a band between roughly 101 and 103.5 that has now mattered three times in a decade.
January 2017: rejected, then fell 13.96%.
April 2020: rejected, then fell 12.60%.
2025: made a lower high at 110, then fell 11.91% straight back into the band. If you hold risk assets then those two dates will mean something to you. They were among the finest entries of the last ten ye
ETH/USD 4H | The Next Impulse or Another Correction?Reading time: ~3 minutes
Is Ethereum Preparing for Its Next Bullish Wave?
Following the previous corrective structure, Ethereum has developed a strong upward move and is now approaching a critical area where price behavior may help reveal its next direction.
In the bullish scenario, the recent advance could be the beginning of a new impulsive structure. However, another correction may still unfold before the next leg higher. The 38.2%–61.8% Fibonacci retracement zone marked on the chart provi
ETH/USD | Running Flat or a Larger Correction?Reading time: ~3 minutes
In this update, I’m considering two different structural scenarios for Ethereum. It’s still too early to choose a definitive direction, so the main focus remains on how the structure develops and how price behaves around key levels.
🟦 Scenario 1: Bullish Case
If the recent corrective structure has completed as a Running Flat, we can expect the bullish trend to resume after the three-wave correction, with price potentially developing into a five-wave impulsive structur
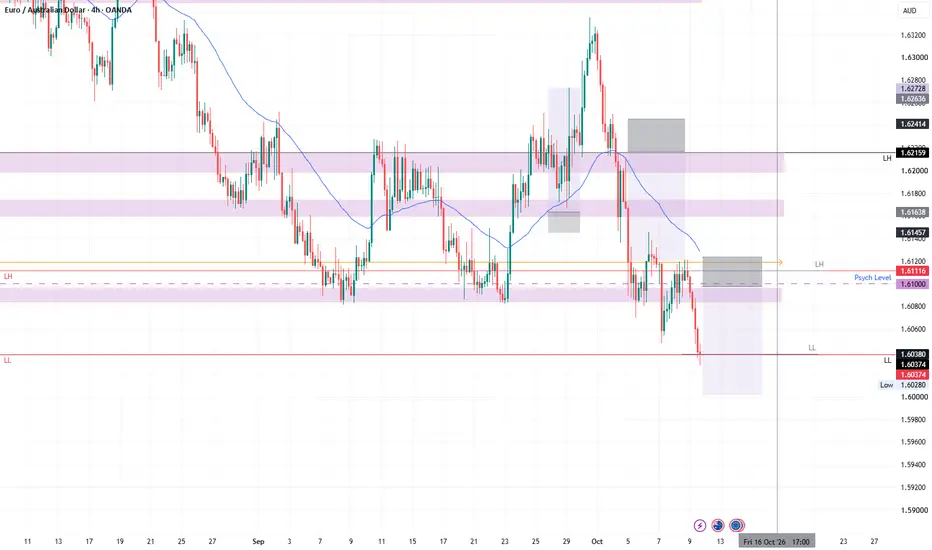
EURAUD SHORTsMarket structure bearish on HTFs 3
Entry at both Weekly and Daily AOi
Weekly Rejection at AOi
Previous Weekly Structure Point
Daily Rejection at AOi
Previous Daily Structure Point
Around Psychological Level 1.61000
Touching EMA H4
H4 Candlestick rejection
Rejection from Previous structure
TP: WHO KNOWS!
Entry 120%
REMEMBER : Trading is a Game Of Probability
: Manage Your Risk
: Be Patient
: Every Moment Is Unique
: Rinse, Wash, Repeat!
: Christ is King