Long
Long
MESU July 1: Pullback first, 7567 above and 7409 belowMESU analysis for Wednesday, July 1
MESU is still trading inside the order block zone from yesterday, and for me today looks like a pullback-first kind of session before the market decides whether to continue higher or rotate lower.
On the 4H chart, the first upside liquidity level I’m watching is 7567. If bulls can stay strong enough, that is the first level I want to see price test.
For the bigger picture, if we eventually get a 4H close above 7600, then I think the tone may need to shift from bearish to bullish.
On the downside, the first level I’m watching is 7490. That is the first pullback target for me if price starts retracing from the current area.
On the 1H chart, the structure still supports the same levels. 7490 remains the first downside level, and 7567 remains the first upside target.
The key warning level for me is 7409. If we get a 1H close below 7409, then I think the market could continue lower toward 7355.
On the 15M chart, I’m watching the lower green highlighted order block zone as the main reaction area. If price taps that area, I want to see whether we get a buy setup or a sell setup from there.
Key levels
7567 = upside liquidity
7490 = first downside target
7409 = hourly warning level
7355 = deeper downside target
7600 = higher-time-frame breakout level
Plan for today
Expect possible pullback first
Watch 7490 on the downside
Watch 7567 on the upside
Reassess if bulls reclaim 7600
Be careful if price loses 7409, because 7355 may come into play next
Not financial advice. No confirmation, no trade. CME_MINI:MESU2026  Short
Short
Nifty Analysis EOD – July 1, 2026 – Wednesday🟢 Nifty Analysis EOD – July 1, 2026 – Wednesday 🔴
Inside Bar Standoff: Nifty Holds Above 24,000
🗞 Nifty Summary
Nifty opened flat to positive and found a base around 23,895, then climbed steadily and gradually up to test 24,020. At this point it faced rejection and slipped sharply by 73 points, but VWAP came to the rescue. Another push higher led to a breach of PDH, though the index couldn’t sustain above it — IBH and R1 on the downside acted as support, and price formed an MC around the mid-session mark. The rest of the session was spent between 24,000 ~ 24,050, and the day closed at 23,988.10, with an adjusted close of 24,005.85, holding above the 24K mark.
Overall, as expected, today looked like a consolidation day — that holds up if we ignore the 15-point upper shadow above PDH, in which case the daily candle forms an inside bar pattern. This session is reminding me of the previous Wednesday’s move, the one right after the Nifty weekly expiry on 23 June.
Going into the next session, bulls will have to deal with the 24,075 ~ 24,125 zone, which could turn into a real hurdle, along with an LTF trendline have to face the same area.
Before any of that though, tomorrow’s opening tick matters most — if it opens inside today’s range, the breakout plan is clearer, but a gap up or down either side means waiting for IB to guide things.
The daily candle forming an inside bar suggests the market might still be deciding its next direction.
🛡 5 Min Intraday Chart with Levels
📉 Daily Time Frame Chart with Intraday Levels
🕯 Daily Candle Breakdown
Open: 23,897.65
High: 24,049.90
Low: 23,895.10
Close: 24,005.85
Change: +140.10 (+0.59%)
🏗️ Structure Breakdown
Type: Strong Bullish — buyers stayed in control through most of the session
Range: ≈154.80 points — moderate volatility
Body: ≈108.20 points — reflects fairly firm buying pressure through the day
Upper Wick: ≈44.05 points — a bit of rejection near the highs
Lower Wick: ≈2.55 points — barely any selling pressure, lows were defended easily
🛡 5 Min Intraday Chart
⚔️ Gladiator Strategy Update
ATR: 244.88
IB Range: 101.30 → Medium
Market Structure: Balanced
Trade Highlights:
09:29 Long Trade: Target Hit (R:R 1:3.62)
11:33 Short Trade: SL Hit
14:34 Short Trade: Trailing SL Hit
Trade Summary: The morning long trade worked out well, hitting target with a solid R:R of 3.62 — the system did its job there. The 11:33 short didn’t work and stopped out, and the 14:34 short also got stopped, though trailing at least protected part of that move. Two out of three not landing is a reminder that not every setup plays out, even when the logic looks fine going in. Still sticking with the process and taking whatever the day gives.
🧱 Support & Resistance Levels
Resistance Zones: 24040 | 24075 ~ 24125 | 24190 | 24235 ~ 24285
Support Zones: 23970 | 23900 | 23855 | 23790 | 23650 ~ 23620
🧠 Final Thoughts
“Some days the market just wants to breathe — today felt like one of those pauses.”
Today felt like a pause after the recent run — price pushed toward 24,020, got rejected, but never really broke down before buyers stepped back in near VWAP.
The 24,075 ~ 24,125 zone looks like the next real test, and the LTF trendline sits right around there too. If tomorrow opens inside today’s range, the plan is clearer; a gap either side and it’s probably better to just wait for IB to settle first.
Nothing to force here — just watching how price reacts at that zone before deciding anything.
✏️ Disclaimer
This is my personal digital diary and represents my own analysis and point of view. It is not financial advice; please consult a professional advisor before making any trading decisions. Nifty Analysis EOD – 30 Jun 2026 – Tuesday🟢 Nifty Analysis EOD – 30 Jun 2026 – Tuesday 🔴
Expiry Drama, Full Day Fakeouts: Never Left the IB
🗞 Nifty Summary
Nifty opened 54 points gap up at 24,032, but sellers stepped in from the very first tick. A sharp 180-point fall pushed the index below PDL (23,900) all the way down to 23,855, where it found support. From there, a 150-point recovery attempted to test the 24,000 zone — but PDVWAP and the Fib 0.786 zone sitting overhead pushed it back down to 23,920.
What followed was a slow, grinding stretch. Nifty stayed locked in a tight 40-point band between 23,920 ~ 23,960 for nearly two and a half hours. Around 1:50 PM, it broke below the intraday bullish trendline and slipped to 23,870 — bears looked like they had it. Then a sharp, shocking 100-point upmove shoved the index back up to 23,970, wiping out all that selling in minutes. But bears weren’t done. From 23,970, they dragged Nifty 143 points lower into the 3 PM candle, marking the day low. The final hour brought an 88-point recovery, with the index closing at 23,917.75 on an intraday basis. The adjusted close settled lower at 23,865.75.
Overall, the day was very active and full of drama — there was no corner left where Nifty didn’t dance. But everything happened inside the IB. This is the third consecutive session closing in red with a decreasing range; for the next session, more consolidation looks likely.
🛡 5 Min Intraday Chart with Levels
📉 Daily Time Frame Chart with Intraday Levels
🕯 Daily Candle Breakdown
Open: 24,032.05
High: 24,035.55
Low: 23,829.20
Close: 23,865.75
Change: −80.50 (−0.34%)
🏗️ Structure Breakdown
Type: Strong Bearish candle — opened near the high, sold off through the day, closed near the lower end
Range: ≈ 206 points — moderate volatility
Body: ≈ 166 points — sellers held control through most of the session
Upper Wick: ≈ 4 points — almost no buying at the open; the gap up was rejected almost immediately
Lower Wick: ≈ 37 points — some demand showed up near the lows, but not enough to change the day’s character
🛡 5 Min Intraday Chart
⚔️ Gladiator Strategy Update
ATR: 251.62
IB Range: 183.6 → Medium
Market Structure: Balanced
Trade Highlights:
9:40 Long Trade: Target Hit (R:R 1:1.56)
10:50 Long Trade: Target Hit (R:R 1:2.48)
12:35 Long Trade: SL Hit
14:00 Short Trade: Trailing SL Hit
15:06 Long Trade: Herozero (R:R 1:3X)
Trade Summary: The first two trades worked cleanly — both longs hit target, and the system was doing its job. The 12:35 long caught the wrong side of that mid-session chop and stopped out, which was fair given how trapped the range was. The short at 14:00 caught the move but trailed out before the full target. The last one at 15:06 was the difficult one — a 3X setup that moved, then came all the way back to zero. Five trades, some good, one frustrating — and a useful reminder that the session doesn’t always end the way the first half suggests it will.
🧱 Support & Resistance Levels
Resistance Zones: 24,025 | 24,075 ~ 24,125 | 24,190
Support Zones: 23,855 | 23,790 | 23,650 ~ 23,620
🧠 Final Thoughts
“A market that dances all day and lands in the same spot is still saying something — maybe it’s just not ready to move yet.”
The most striking thing about today was how much the market moved without actually going anywhere. Sharp drops, sharp recoveries, whipsaws in both directions — and six hours later, the index settled just a little lower than where it opened. Everything happened, and nothing broke.
For tomorrow, 23,855 is the level worth watching on the downside. If it holds, there’s a possibility Nifty tries to work back toward 24,025 ~ 24,075. If 23,855 gives way cleanly, 23,790 comes into the picture and the consolidation might get a bit messier before it resolves.
Three red sessions, each with a smaller range than the last — something could be building here, but the direction isn’t clear yet. The plan for tomorrow is to let the IB form, stay patient with the early noise, and not force a trade just because the day looks quiet.
✏️ Disclaimer
This is my personal digital diary and represents my own analysis and point of view. It is not financial advice; please consult a professional advisor before making any trading decisions.
AUDNZD at PRZ and Yearly Resistance — Watch This CloselyAUDNZD ( FX:AUDNZD ) is currently moving within a heavy resistance zone(1.2524 NZD-1.2120 NZD), near the resistance lines, and the yearly resistance(2), while also being inside the Potential Reversal Zone (PRZ) .
From an Elliott Wave perspective, it appears AUDNZD has completed its main wave 5 by the ending diagonal and is now forming a Zigzag correction(ABC/5-3-5).
I expect AUDNZD, after breaking the support lines, to decline at least toward 1.216 NZD.
First Target: 1.2160 NZD
Second Target: 1.2130 NZD
Stop Loss(SL): 1.2287 NZD
Points may shift as the market evolves
Note: Tomorrow, the key CPIs(AUD) and indices will be released, and upon their publication, we may see heightened volatility in the AUDNZD pair.
What’s your view on AUDNZD?
💡 Please respect each other's opinions and express agreement or disagreement politely.
📌Australian Dollar/New Zealand Dollar Analysis (AUDNZD), 4-hour time frame.
🛑 Always set a Stop Loss(SL) for every position you open.
✅ This is just my idea; I’d love to see your thoughts too!
🔥 If you find it helpful, please BOOST this post and share it with your friends.  Long
Long
MESU June 30: Watch 7482 or 7517 for directionMESU analysis for Tuesday, June 30
MESU is trading back inside a key order block / reaction zone, and for me this looks like an important decision area for today.
On the 4H chart, price is pushing into the green highlighted zone while also sitting under broader resistance. Because of that, I’m watching for seller reaction from this area, but I still want confirmation before taking bias too aggressively.
The main downside expectation for this week remains around 7400, but for today the key trigger level is 7482. If price starts closing below that level, I think continuation lower becomes more likely.
On the upside, the first reclaim level I’m watching is 7517. If bulls can get acceptance above that level, then I’ll be watching for continuation higher toward 7550.
Key levels
7482 = key downside trigger
7517 = upside reclaim level
7550 = upside target
7400 = broader downside target
Green zone = order block / reaction area
Plan for today
Respect the reaction zone
Watch 7482 for bearish continuation
Watch 7517 for bullish reclaim
If bulls reclaim strength, target 7550
If sellers stay in control, keep 7400 in mind
Not financial advice. No confirmation, no trade. CME_MINI:MESU2026 Short 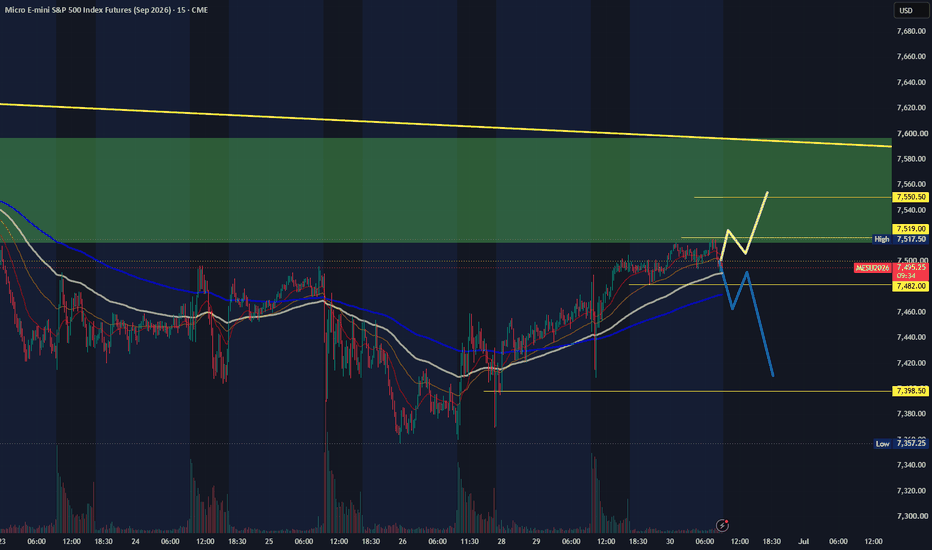
 Long
Long
 Long
Long
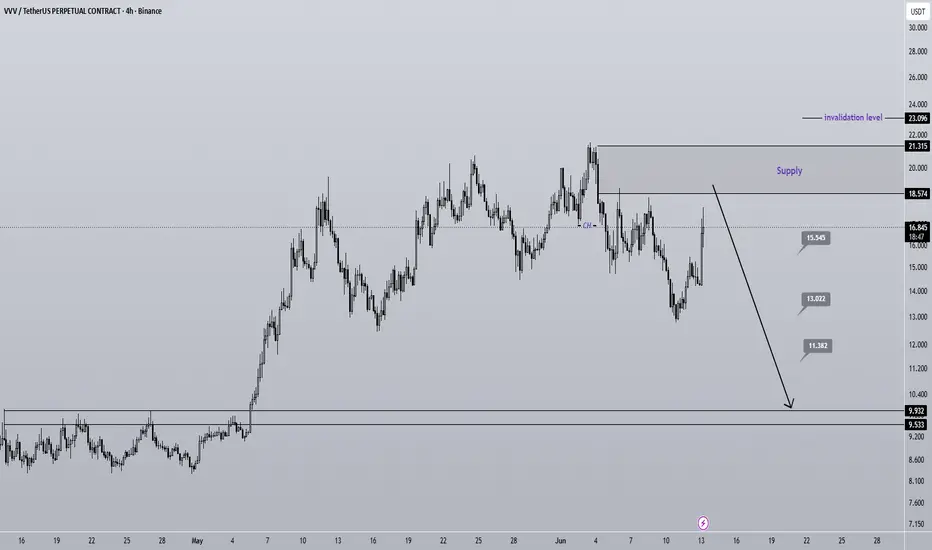
Will VVV crash again?This analysis is an update to the previous analysis linked in the related publications section.
If you've been following us, you know that we caught a great trade and position on VVV, and the price reversed upward precisely from our take profit level.
At the moment, VVV appears to be forming a bearish Head and Shoulders pattern. Since we also have a bearish Change of Character (CHoCH) on the chart, a significant drop could occur if price fails to close a candle above the ATH. Therefore, a short setup on VVV may present a favorable opportunity.
Be sure to enter only within the marked supply zone. Also, due to the wide trading range and high volatility of this coin, proper risk management is essential.
The targets are marked on the chart. Once TP1 is reached, move your stop loss to break-even.
A daily candle close above the invalidation level will invalidate this analysis.
If you would like us to analyze a coin or altcoin for you, first like this post, then comment the name of your altcoin below.
What is your opinion about VVV?  Long
Long
 Long
Long