TRX Breaks a Two-Month Range — Acceptance or Deviation?TRX has finally pushed above the upper boundary of the broader 4H range around 0.3334, after spending roughly two months trading below it. The initial structure following the breakout is constructive: price moved above the range, pulled back toward the breakout area and has so far remained above it.
────────────────────────────
4H CONTEXT
────────────────────────────
The 4H chart is the main context here. The former range high around 0.3334 was tested repeatedly during June and July before the current expansion finally moved through it. Price is now trading above that level while the broader structure remains bullish.
For now, that looks more like an acceptance attempt above the old range than a simple wick through resistance.
────────────────────────────
1H STRUCTURE
────────────────────────────
The 1H chart adds useful detail underneath the breakout. Bullish OBs have formed around the move, the pullback held above the broader breakout area, and the structure has continued with additional bullish BOS.
That gives the current move some internal structure rather than just one isolated push above the range.
────────────────────────────
RETEST OR DEVIATION?
────────────────────────────
The key distinction now is whether the former range high can remain accepted structure.
If TRX continues holding above roughly 0.3334 while the 1H structure remains constructive, the breakout-and-retest interpretation stays intact.
If price loses that area and begins closing back inside the old range, the move above the highs starts looking more like a deviation than a successful breakout.
────────────────────────────
CURRENT READ
────────────────────────────
At the moment, the evidence leans toward bullish breakout acceptance, with 4H and 1H structure aligned in the same direction. The 15m also remains constructive, but I would treat that as lower-timeframe detail rather than the main reason for the view.
The level that matters most is still the old 4H range boundary. The next few higher-timeframe closes should make the distinction between acceptance and deviation much clearer.
Would you classify this as a clean breakout/retest already, or are you still waiting for more acceptance above the former range high?
Structure observations, not signals.  Long
Long
 Long
Long
$BTC. Where to expect a pullback? Chart analysis.The week of CRYPTOCAP:BTC anomalous run is wrapping up. Time to analyze the chart after support levels got rebuilt.
Right now price is right up against the historically strong monthly resistance 📊M-Levels $81650–$84500, where as 🧩IMA points out, 🐋large players started taking some profits.
Spot market also shows dropping inflows, from this we can conclude that the market took a pause and growth continues without new capital backing it.
A straight-up breakout of monthly resistance and further growth with this data is unlikely, in this setup if 🐋large players' mood stays bullish, a pullback to support levels for a reload looks logical, and only then a resistance breakout.
Chart shows that the nearest monthly support is 📊M-Levels $74000–$76000, where we should expect a reaction from 🐋large players.
Next strong 📊M-Levels $68340–$70900 I consider even more weighty, which is backed by order volume accumulation, a break of this level will break the growth structure, which could again lead to a prolonged flat.
Friends, that's my take on Bitcoin.
If you liked the analysis - support it with a rocket 🚀.
🧩IMA — Integrated Market Analysis
📊M-Levels — Institutional Interest Levels
⚠️ Platform restrictions don't allow publishing closed indicators. I only display the result of the 📊Levels algorithm.
 Long
Long
Short 
Short 
Short 
 Long
Long
Liquidity Pools Explained: How Do They Actually Work?⚠️ Disclaimer: This post is for educational and informational purposes
If you’ve spent any time in DeFi, you’ve probably heard the term Liquidity Pool.
But what exactly is it?
Why do people put their crypto into these pools?
How do traders use them?
And where does the liquidity provider actually make money?
Let’s break it down step by step. 👇
🔹 What Is a Liquidity Pool?
A liquidity pool is a smart-contract-based pool containing two or more crypto assets that are deposited by users.
These assets provide the liquidity needed for decentralized trading.
For example, imagine an ETH/USDC liquidity pool.
The pool might contain:
500 ETH
1,000,000 USDC
Users can trade ETH for USDC — or USDC for ETH — directly against the pool without needing a traditional buyer and seller to match their orders.
The people who deposit these assets are called Liquidity Providers (LPs).
🔹 Why Do Liquidity Pools Exist?
Traditional exchanges usually rely on an order book.
An order book matches:
Buyer → Seller
But decentralized exchanges (DEXs) can use a different model called an Automated Market Maker (AMM).
Instead of waiting for another person to place the opposite trade, users trade against the liquidity held inside the pool.
So the basic structure looks like this:
Liquidity Providers → Liquidity Pool → Traders
LPs provide the capital.
Traders use that liquidity.
The protocol's smart contract manages the trades according to its rules.
🔹 How Does an AMM Determine the Price?
One of the classic AMM models uses the formula:
x × y = k
Where:
x = amount of Token A
y = amount of Token B
k = a constant
Suppose a pool contains:
10 ETH × 20,000 USDC = 200,000
If someone buys ETH from the pool, the amount of ETH decreases.
To maintain the relationship defined by the AMM, the amount of USDC in the pool increases.
This means the price changes as trades happen.
Bigger trade → Bigger price impact
This is one reason liquidity depth matters.
A large pool can generally handle larger trades with less price impact than a very small pool, all else equal.
🔹 Where Does the Liquidity Come From?
The liquidity comes from users.
Imagine you provide:
$5,000 worth of ETH
and
$5,000 worth of USDC
to an ETH/USDC pool.
You have supplied $10,000 of liquidity.
In return, the protocol records your share of the pool.
Depending on the protocol, you may receive LP tokens or another form of position representation.
Your share allows you to participate in the pool's economics and, subject to the protocol's rules, withdraw your portion later.
🔹 How Do Liquidity Providers Earn?
The main source is usually trading fees.
Suppose traders continuously swap ETH and USDC through the pool.
Every trade may generate a fee.
A portion of those fees can be distributed to liquidity providers according to the protocol's rules.
For example:
Trader swaps:
$100,000
If the applicable trading fee is 0.30%, the fee would be:
$300
That fee doesn't automatically mean every LP receives $300.
The distribution depends on the protocol, pool design, incentives, and your share of the relevant liquidity.
So:
More trading volume + sufficient liquidity + attractive fee structure
can potentially create more fee revenue for LPs.
But this does not mean LPs are guaranteed to make money.
🔹 The Big Risk: Impermanent Loss
This is probably the most important concept to understand before providing liquidity.
Let's say you deposit:
ETH + USDC
Then ETH's market price changes significantly.
The AMM's mechanism causes the pool's asset composition to change as traders arbitrage the pool toward the market price.
You may end up holding:
Less ETH + More USDC
than you would have if you had simply held the original assets in your wallet.
The difference is commonly referred to as impermanent loss.
Why "impermanent"?
Because if the relative prices return to the appropriate original relationship before you withdraw, the difference can disappear.
But once you withdraw, the loss relative to simply holding the assets can become realized.
And if trading fees and other rewards don't compensate for that difference, providing liquidity may underperform simply holding the assets.
🔹 Simple Example
Imagine you deposit:
$5,000 ETH + $5,000 USDC
Total:
$10,000
Now imagine ETH's price increases dramatically.
Arbitrage traders interact with the pool, changing its ETH/USDC ratio.
When you later withdraw, you might receive something like:
$7,000 ETH + $7,500 USDC
Total:
$14,500
Sounds great, right?
But here's the important comparison:
If you had simply held your original ETH and USDC instead of providing liquidity, your portfolio might have been worth $15,500.
The difference is the economic effect commonly described as impermanent loss, before considering the fees and rewards you earned.
So you shouldn't look only at:
"How much money is inside my LP position?"
You should compare it against:
"What would I have if I had simply held the same assets?"
🔹 Other Risks You Need to Understand
Liquidity pools aren't simply a way to earn passive income.
There are several risks.
1️⃣ Impermanent Loss
Changes in the relative prices of the assets can reduce your performance compared with holding the assets separately.
2️⃣ Smart Contract Risk
Your funds interact with code.
If the underlying smart contract has a vulnerability, exploit, or design flaw, funds can potentially be lost.
3️⃣ Token Risk
Providing liquidity for a highly volatile or low-quality token can expose you to significant losses.
A token can lose most or all of its value.
4️⃣ Stablecoin Risk
Even stablecoins aren't completely risk-free.
They can experience depegging, liquidity issues, or other risks.
5️⃣ Low Liquidity
Small pools can experience significant price impact.
This can also make exiting a position more difficult or costly.
6️⃣ Protocol Risk
A protocol may have economic, governance, oracle, or implementation risks beyond the basic AMM mechanism.
7️⃣ Incentive Risk
Some pools offer additional token rewards.
But those rewards can decrease in value or disappear entirely.
A high advertised APY doesn't automatically mean high profit.
🔹 What Is APY in Liquidity Pools?
You may see something like:
APY: 25%
or
APR: 80%
Don't immediately interpret this as guaranteed return.
These numbers can depend on:
Trading volume
Pool liquidity
Token prices
Fee distribution
Incentive emissions
Reward-token price
Compounding
Protocol changes
An APY displayed today can be very different tomorrow.
🔹 Why Do Traders Need Liquidity?
Imagine you want to swap:
$100,000 USDC → ETH
You need someone or something willing to sell you that ETH.
In a DEX using an AMM, the liquidity pool provides the assets needed for the swap.
Without sufficient liquidity:
Large trade → High price impact → Worse execution
With deeper liquidity:
Large trade → Lower price impact → Better execution
This is why liquidity is one of the fundamental building blocks of DeFi.
🔹 The Liquidity Provider's Trade-Off
Providing liquidity is essentially a trade-off.
You are giving the market access to your capital.
In return, you may receive:
💰 Trading fees
🎁 Incentive rewards
📈 Potential additional yield
But you're also accepting:
⚠️ Impermanent loss
⚠️ Smart-contract risk
⚠️ Token price risk
⚠️ Stablecoin/depeg risk
⚠️ Protocol risk
So the correct question isn't:
"What is the APY?"
A better question is:
"Is the expected fee/reward income sufficient to compensate me for the risks I'm taking?"
🔹 Liquidity Pools in One Simple Picture
Think of a liquidity pool like a shared inventory warehouse.
LPs put assets into the warehouse.
Traders come and exchange assets from that inventory.
The warehouse charges a fee for facilitating those trades.
LPs can receive a portion of the economics generated by the activity.
But the inventory composition changes as people trade.
And the value of what you eventually withdraw may be different from what you originally deposited.
That's the core idea behind liquidity pools.
🧠 The Takeaway
A liquidity pool allows users to deposit crypto assets into a smart contract so traders can swap those assets through a decentralized exchange.
LPs provide liquidity → Traders use liquidity → Trades generate fees → LPs may receive a share of those fees.
But liquidity providing isn't "free money."
The biggest concepts to understand are:
AMMs + Trading Fees + Price Impact + Impermanent Loss + Smart Contract Risk + Token Risk
If you understand those six concepts, you'll have a much stronger foundation for understanding DeFi liquidity pools.
Always do your own research (DYOR), understand the specific protocol and pool mechanics, and never deposit money you cannot afford to lose.
⚠️ Disclaimer: This post is for educational and informational purposes only and should not be considered financial, investment, trading, tax, or legal advice. Cryptocurrency and DeFi involve substantial risks, including the possible loss of some or all of your funds. Always conduct your own research and consider consulting a qualified professional before making financial decisions.  Education
MESU Aug 27: 7707 Pullback Before a 7741 Breakout?MESU pushed higher overnight and is currently trading around 7,715.
The first downside liquidity level I’m watching is around 7,707. Price may pull back into that area before attempting another move higher.
For the broader bullish structure, 7,690 is the key support level. A confirmed 4-hour close below 7,690 would weaken the bullish scenario and could open the door toward 7,655.
On the upside, the overnight high around 7,741 remains the main liquidity target. A confirmed 4-hour close above that level could support continuation toward approximately 7,765.
Key levels
7,707 — first downside liquidity
7,690 — key bullish support
7,655 — deeper downside target
7,741 — upside liquidity / breakout level
7,765 — next upside target
Bullish scenario: Hold the 7,707–7,690 area → reclaim 7,741 → target 7,765.
Bearish scenario: Lose 7,707 → watch 7,690. A confirmed higher-time-frame break below 7,690 could open 7,655.
For now, I’m waiting for price to reach one of these levels and give confirmation before taking a directional setup.
Not financial advice. No confirmation, no trade. CME_MINI:MESU2026  Long
Long
 Long
Long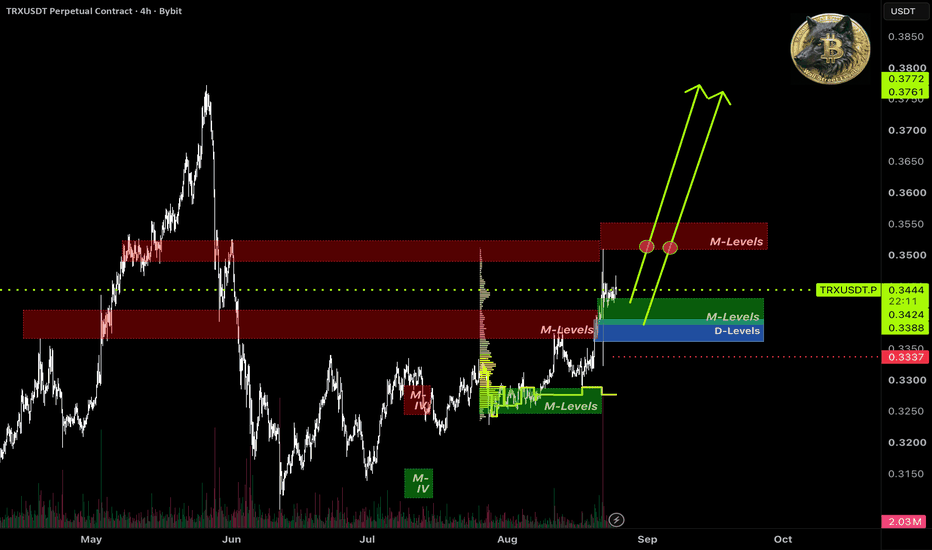
 Long
Long
 Long
Long
Short 
Short 
 Long
Long
 Long
Long


