NAS100
The asset has reached our 1.414 area of interest.
I am now looking for local consolidation and confirmation for a potential move higher. During the decline, a key imbalance was formed, which in my view still requires external expansion.
As long as the current zone holds, the main scenario is a move higher toward the upper 1.414 area.
Scenario: POI → Consolidation → Reversal → External Expansion.
Pivot Points
XAUUSD · 15M
The asset has shown a strong expansion higher with almost no proper rebalance into the 0.5 zone.
A key imbalance has formed at the current levels, aligning with the external expansion area and acting as a potential price magnet. A Daily FVG is also located above.
I expect a sweep of the upper liquidity and price delivery into this area. After a reaction, the main scenario is a move lower followed by a rebalance toward the 1.414–1.618 external POI.
Scenario: Liquidity Sweep → Daily FVG → Reversal → Rebalance → External POI.
USDCAD · 1H — Bullish Expansion ScenarioDuring the previous bearish move, price did not receive a full rebalance into the 0.5 Fibonacci area within this dealing range.
Price is currently reacting from a local zone, and I allow for a small pullback / additional rebalance before further upside continuation.
The key factor is the unmitigated imbalance, which creates conditions for continued external expansion.
Main targets:
1.0 → 1.414
If momentum remains strong, the next delivery area may extend toward 1.618.
As long as the marked invalidation area holds, the bullish scenario remains valid.
$BTC - Market Update (8/26)Good Morning! Added the pink path, same levels.
We're almost done completing this range, gonna be interesting to see how it resolves.
We got our double distribution sweeping the highs into 81k. We're currently rejecting at 79.2k, but if we hold 78k coming into NY, I'd expect a retest of 80k–80.5k.
Wny rejection there and that's another short opportunity back to the 77–76k base.
CRUDE OIL (WTI): Pullback From Key Level
WTI Crude Oil tested a major key level.
A bullish engulfing candle formation on an hourly time frame confirms
a strong buying activity around that structure.
I expect a pullback to 81.47 level.
❤️Please, support my work with like, thank you!❤️
I am part of Trade Nation's Influencer program and receive a monthly fee for using their TradingView charts in my analysis.
$SOL: What's next. Short or long?BYBIT:SOLUSDT.P
Solana trades above the new support level 📊M-Levels 91$ - 95$.
The 4h chart shows the market swept the shorts.
But in my opinion, this is a trap.
🧩IMA analysis shows: 🐋large players continue to hold long positions.
Another factor for the continued move is buying dips on the spot market.
Considering possible high volatility, it is better to look for entry in the range of monthly support and liquidity zone.
🟡 Trade plan:
🟢 Entry 1: around 94$
🟢 Entry 2: around 90$
🛑 Stop: around 86$ (conservative).
If you liked the analysis - support with a rocket 🚀.
🧩IMA — Integrated Market Analysis
📊M-Levels — Institutional Interest Levels
⚠️ Platform restrictions do not allow publishing closed indicators. Displaying only the result of the algorithm work 📊Levels.
$ICP: Waiting for resistance breakout🚀 BYBIT:ICPUSDT.P
Price is trading in the monthly resistance range 📊M-Levels $2260–$2400, and right now this zone is the main obstacle to further upside.
🧩IMA points to strong interest from 🐋large players building positions on every dip. The weekly analysis also shows positions have been building for the second week in a row.
Even with real capital interest showing, entering at current levels is premature because 📊M-Levels are close and there is risk of a further pullback to the daily consolidation level at $2135.
🟡 Action plan:
🟢 1. Entry in the $2260–$2400 range only on a breakout of monthly resistance.
🟢 2. Entry at the daily consolidation level $2135 only if 🐋large players confirm interest.
📌 Strategy logic: assets don’t run where retail is sitting, they run where capital is flowing in.
Analysis from me — execution from you 🚀
Analysis powered by 🧩IMA (Integrated Market Analysis)
📊M-Levels — Institutional Interest Levels
⚠️ Platform restrictions limit the publication of closed indicators. I display only the output of the 📊Levels algorithm.
1.618 impulse. We’ll try applying Fibo circles to analyze the entire crypto market.
So, we have a fairly clear previous bottom in November 2022 and
a peak in September 2025.
Let’s overlay them…
There we go!
The impulse move that has just taken place bounced precisely off the 1.618 line.
This is a fairly clear sign that the structure is still intact. Therefore, starting from
the second green arrow, we can try to determine the ranges within which the market
may develop.
What we definitely don’t know is the angles of attack at individual points in time.
However, it would be correct to mark where, by date, the 1.618 level ends and
the 2.618 territory begins, because level transitions will most likely involve pauses,
pullbacks, and sideways movements.
So, with this setup, the 1.618 boundary falls at the end of January 2028.
I propose the following box. This is my original solution.
The upper side of the box clearly continues the 2022–2025 trend.
And its lower corner corresponds to the important $1.06T range,
where we observed significant accumulation in 2023, followed by growth.
So, here is the range of possible events for the next 1.5 years: $1.06T–$12.72T .
This does not mean that $12.72T will necessarily be reached.
It means that it is definitely impossible to go above this peak, because that would
essentially be a retest of the trend from below, and there would be a rejection there.
And one final observation: on the Rainbow 9 Seasons indicator , two timeframes have turned blue, indicating that the market has reached a state of strong oversold conditions. As soon as they turn green, the rally will have no trouble proving itself.
Best Indicator to Find Psychological Levels in Gold Trading
There is one free technical indicator that will show you every significant psychological level on Gold XAUUSD chart.
It is available on TradingView and it is very easy to set.
Discover the best psychological support and resistance indicator for Gold trading, its settings, and useful tips.
First, let's discuss the significance of psychological levels in GOLD XAUUSD analysis and trading.
The classic way of the search of significant supports and resistance is based on the analysis of a historic price action.
However, while Gold constantly sets new historic highs such a method does not work, because there are no historic resistances to rely on.
In such a situation, the only reliable strategy to find potentially strong resistances is to analyze psychological levels.
Psychological levels are the round numbers based price levels. Because of the common human psychological biases, these levels attract the interest of the market participants and the prices tend to react to them.
A great example of a psychological level in Gold trading is 3000 level.
It served as resistance first and, after a breakout, turned into an important support.
And I found a free technical indicator that plots all the significant psychological levels efficiently.
One more thing to note is that I strictly recommend searching for psychological levels on a daily time frame, because it provides the most relevant perspective.
To use this indicator, search "round" in the indicators window on TradingView.
It is called "Round numbers above and below".
Click on that, and it will start working immediately.
You can see that the indicator plotted 3 significant psychological resistances above current prices and 3 supports below on Gold chat.
In the settings of the indicator, you can change the number of levels to identify and change the style of the horizontal lines.
Examine the reaction of the price to psychological supports that the indicator shows. These levels may remain significant in futures and applied for pullback/breakout trading.
This free technical indicator on TradingView will help you in your search of the strongest ones.
❤️Please, support my work with like, thank you!❤️
I am part of Trade Nation's Influencer program and receive a monthly fee for using their TradingView charts in my analysis.
Pricol Ltd - Cup & HandlePricol Ltd
Sales - QoQ - 12.5%, YoY - 50.5%
Net Profit - QoQ - 28%, YoY - 42.2%
2 good quarters. Valuations are good among the peers. 35% potential. 548-556 is good range to enter or above 600 with SL 522. Cup and Handle breakout. Good volume. Pivot, Fib, cup targets are in chart.
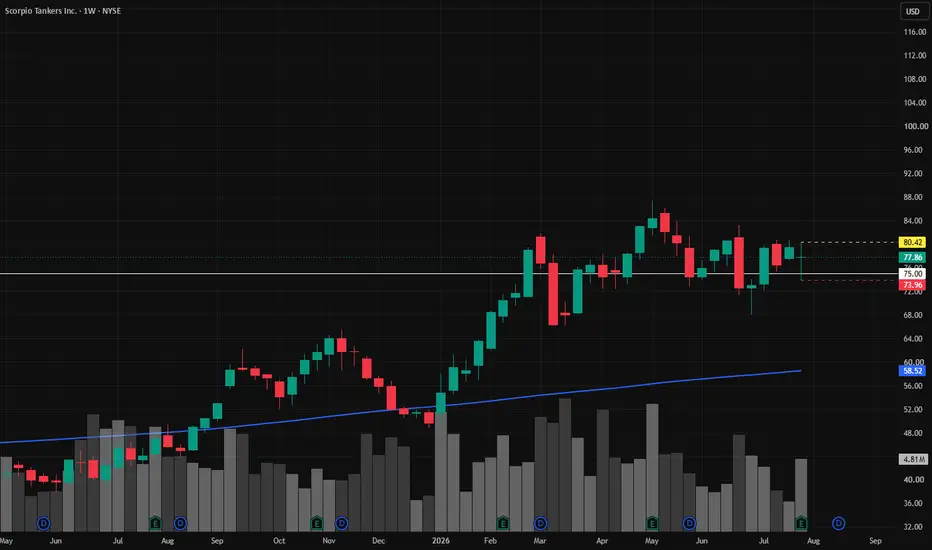
STNG | Continued stock growth- Timeframe: Weekly
- Trade type: Buy stop order
- Price: 80.42
- Take Profit: Open
- Stop Loss: 73.96 (-8.00 %)
Idea: Long on a breakout above last week's high - bullish momentum continuation.
Entry: Buy stop above last week’s high.
Stop-loss: Below the low of the same candle.
If the weekly candle closes below this level, the trade is invalidated.
Take Profit: Trailing stop following the lows of new weekly candles.
BSX | Continued stock growth- Timeframe: Weekly
- Trade type: Buy stop order
- Price: 50.16
- Take Profit: Open
- Stop Loss: 47.10 (-6.10 %)
Idea: Long on a breakout above last week's high - bullish momentum continuation.
Entry: Buy stop above last week’s high.
Stop-loss: Below the low of the same candle.
If the weekly candle closes below this level, the trade is invalidated.
We hit the first tp. What's next?If price consolidates above 4680:
- Close 30–40% of the position.
- Move the remaining SL to 4662.18 (Break-even).
If 4680 breaks and holds
Keep the remaining position:
- TP2 = 4695
Around 4695 if momentum weakens:
- Close another 30%.
- Trail the remaining SL under the last 5-minute Higher Low — not a fixed number.
Final target
4710
According to the past analysis, what should we do now?
Entry = 4662.18
SL = 4648
Current price ≈ 4676.7
Initial risk = 14.18 dollars.
Suggested Exit Plan
Now:
Do not move the SL yet, because we have not reached TP1 = 4680.
At 4680
If price consolidates above 4680:
- Close 30–40% of the position.
- Move the remaining SL to 4662.18 (Break-even).
If 4680 breaks and holds
Keep the remaining position:
- TP2 = 4695
Around 4695 if momentum weakens:
- Close another 30%.
- Trail the remaining SL under the last 5-minute Higher Low — not a fixed number.
Final target
4710
Hold the remainder until there, unless the 5M bullish structure breaks.
Important rule
If price pulls back before 4680:
As long as 4648 has not been broken, there is no emergency exit.
We do not confuse normal volatility with a structure change.
Summary:
4662 Entry → 4680: Partial + BE → 4695: Partial + Trail → 4710: Final exit
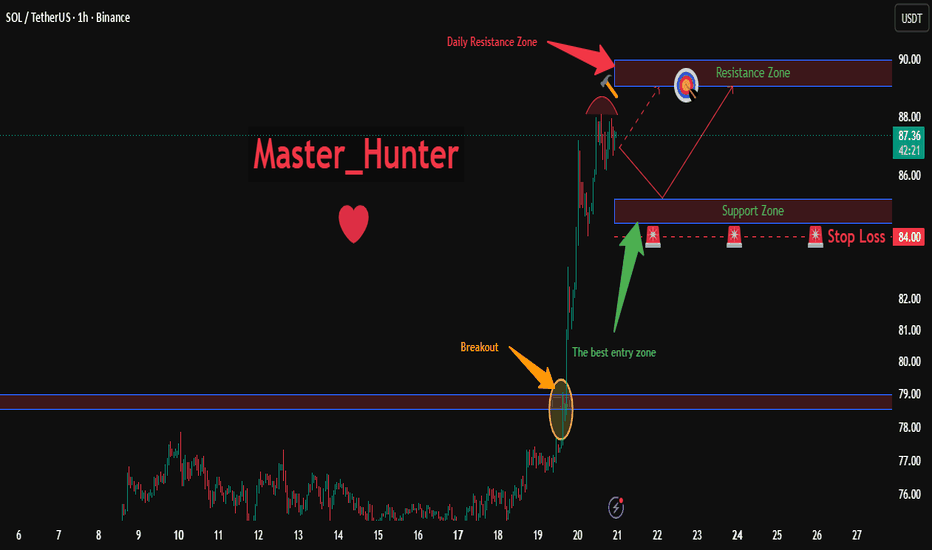
SOLUSDT: Bullish Push to 89?As the previous analysis worked exactly as predicted, BINANCE:SOLUSDT is eyeing a bullish continuation on the 1-hour chart after a clear breakout, with price approaching a key support zone that could serve as the best entry area to ignite further upside momentum toward the daily resistance zone if buyers defend amid volatility. This setup offers a solid rally opportunity with more than 1:3 risk-reward .🔥
Entry between 84.5–85.2 (entry from current price with proper risk management is recommended). Target at 89 . Set a stop loss at a 4-hour close below 84 , yielding a risk-reward ratio of more than 1:3 . Monitor for confirmation via a bullish candle close above entry with rising volume, leveraging Solana’s strength near support.🌟
📝 Trade Setup
🎯 Entry (Long):
84.5 – 85.2
(Entry from current price is acceptable with proper position sizing and strict risk management.)
🎯 Target:
89.0
❌ Stop Loss:
4-hour candle close below 84.0
📈 Risk-to-Reward:
More than 1:3
💡 Will buyers defend the 84.5–85.2 breakout-retest zone and push SOL toward 89, or will the breakout turn into a failed move? 👇
GBPUSD up-moves to continue?Price is moving in the bullish direction with no signs of weakness, momentum is very strong, recently after reclaiming the level of 1.3675 price had started to retrace which got supported by the level of 1.3618 form where price had faced multiple bounce backs, this consolidation is evolving by being above the bullish trendline.
We are expecting price to continue it's consolidation, until it retests it's rising trendline without breaking immediate support, after the retest if price gives breakout above 1.3656 (Immediate resistance) than that could be a nice opportunity to take fresh longs as we would be anticipating continued move in the bullish direction after the consolidation phase.
however taking shorts to capture small declines should be avoided as taking trades against the dominant trend could be risky.
For Educational Purposes only, Not an Investment Advice, Always use strict Risk management measures.
Regards CrazyTrades247.
NEAR/USDT · 1HAfter a strong upside expansion, price returned into the premium area and is now forming a local reaction around the 0.214–0.25 zone.
The main scenario is a move lower toward the EMA Shelf around 1.60, where I plan to take 75% profit. If bearish delivery continues, the final target remains the 1.414–1.618 external POI.
Idea invalidation — acceptance above the current high.
Scenario: Premium → Reversal → EMA Shelf → External POI.
$BTC + alts: Situation breakdown 24/08BYBIT:BTCUSDT.P
BTC price is trading at the border of the monthly support level 📊M-Levels 73500$–76150$.
IMA data shows that 🐋large players are adding to long positions and are positioned for continued rise.
On weekends the market practically stood still, with the exception of the alts market where they knocked out stops pretty well.
The shortened USA session also showed no activity, not giving an understanding of the market mood. As practice shows, after the weekend flat, a sharp move is expected on Monday. And if you look at the level structure and the mood of 🐋large players, the probability of a test of the entire 📊M-Levels range looks more preferable.
Among alts, you can highlight a group of coins ZEC, GRAM, DOGE, LINK, FIL, HBAR, ATOM, NEAR, CAKE, APT, ICP, where buyer pressure especially stands out from the rest of the market and you can look at entry into positions on a pullback.
My plan for BTC is to wait for a test of support and based on market reaction make a decision about entering a position. More precise entry levels and market mood can be said only after the end of Monday's session.
Analysis from me — execution from you 🚀
🧩IMA — Integrated Market Analysis
📊M-Levels — Institutional Interest Levels
⚠️ Platform restrictions limit the publication of closed indicators. I display only the output of the 📊Levels algorithm.
EURUSD NEW HIGH ⚔️🔜
🚀 Euro is Soaring & Headed for Spectacular New Highs! 📈🇪🇺
The EUR/USD pair is showing massive bullish momentum, and all indicators suggest we are on track to hit a fantastic new high very soon.
🔥 Key Drivers Behind the Rally:
1️⃣ DXY Collapse: A sharp drop in the U.S. Dollar Index is fueling the Euro's upward surge.
2️⃣ Bond Market Dynamics: Shifts in bond yields continue to weigh heavily on the USD, giving the Euro a massive boost.
💡 Market Outlook: The bullish trend remains strong—keep an eye on upcoming resistance levels.
What are your thoughts? Do you think EUR/USD will break the next high smoothly? Let me know below! 💬👇
#Trading #EURUSD #Forex #DXY #Bonds #FinancialMarkets #Bullish