Long
Long
Short 
 Long
Long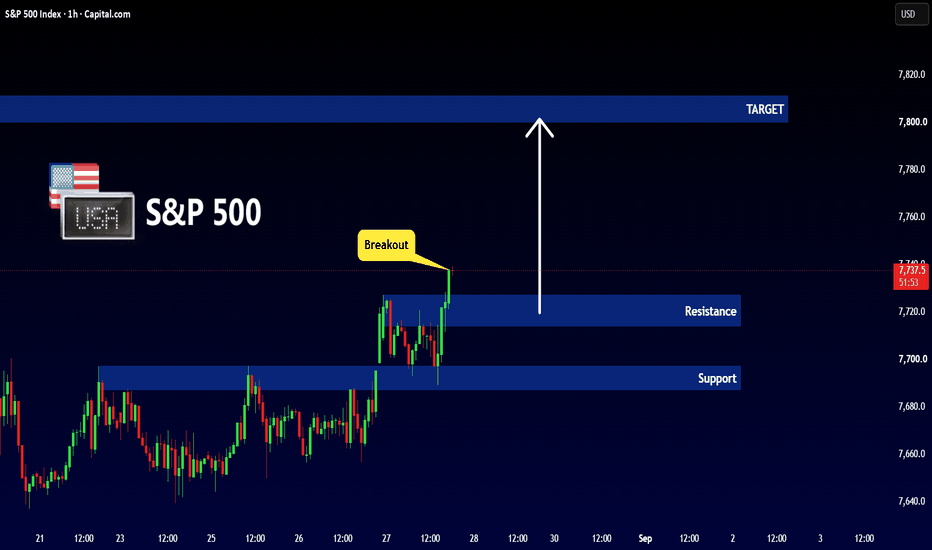
MESU Aug 28: Neutral Between 7723 and 7755MESU remains inside a relatively balanced short-term structure, so my bias for today is neutral until price confirms outside the current range.
On the downside, the first liquidity level I’m watching is around 7,723.
The more important bearish confirmation level is 7,700. A confirmed 4-hour or 1-hour close below that area would weaken the current structure and shift my bias from neutral to bearish.
On the upside, 7,755 is the first liquidity level. A confirmed 15-minute close above 7,755 could support continuation toward 7,764.
Key levels
7,723 — first downside liquidity
7,700 — bearish confirmation
7,755 — upside liquidity / bullish trigger
7,764 — next upside target
Bullish scenario: Break and hold above 7,755 → target 7,764.
Bearish scenario: Lose 7,700 with higher-time-frame confirmation → shift bearish and watch for further downside.
While price remains between these levels, I’m treating the market as range-bound and waiting for confirmation.
Not financial advice. No confirmation, no trade. CME_MINI:MESU2026  Long
Long
Holding $80K keeps $82.5K in playHey traders! 👾✊🏼
For 8 consecutive sessions, we’ve seen significant capital inflows into U.S. spot crypto ETFs, with total inflows now reaching an impressive $3.8B 💰💰💰
As I mentioned earlier, this rally is no longer being driven solely by short covering. We’re also seeing continued institutional demand supporting the move.
So, what’s happening on the chart right now? 🧐
It’s pretty clear that the bulls have no intention of giving up control just yet. Price is currently trying to establish itself above the upper boundary of the $76–80K trading range.
In my last post, I wrote:
🦬🚀 “Holding the $78K level followed by a breakout above $80K will almost certainly send price toward a local high breakout and the $82.5K level.”
That scenario is playing out right now, and we could very well see $82.5K in the near future.
🐻🪓However, despite what looks like the best possible news, growing euphoria, and billions of dollars flowing into Bitcoin ETFs, Bitcoin can always paint the opposite picture. So keep the bearish scenario in mind as well.
If the current breakout above $80K turns out to be a fakeout, price could quickly fall back toward the middle of the range at $78K.
I’ve already outlined the next scenario:
“Failure to hold $78K would weaken the bulls’ position and could quickly send price toward the lower boundary of the range at $76K. A break below $76K would open the door for bears to extend the correction toward $73.7K.”
Peace! 🌄
⚠️ Disclaimer:
All information shared on this channel is for educational and informational purposes only and is not investment advice. The author is not responsible for your trading decisions. Always manage your risks and make decisions independently. Long 
MESU Aug 26: Range Between 7655 and 7714 Before NVDAMESU remains inside a choppy higher-time-frame range, with 7,655 and 7,714 acting as the primary boundaries.
For today, my base case is continued range-bound price action rather than an immediate directional breakout.
Inside the range, short-term liquidity sits around 7,670, which could be swept before price makes its next larger move.
On the upside, 7,714 is the key decision level. A confirmed breakout and acceptance above that level could open the path toward 7,733, followed by the larger upside liquidity around 7,764.
On the downside, 7,655 remains the key support. If price loses that level with confirmation, the deeper higher-time-frame level around 7,625 comes back into play.
Key levels
7,670 — intraday liquidity
7,714 — upside decision / breakout level
7,733 — first breakout target
7,764 — larger upside target
7,655 — range support
7,625 — deeper downside target
Bullish scenario: Hold the lower range and reclaim 7,714 → target 7,733, then potentially 7,764.
Bearish scenario: Lose 7,655 with confirmation → watch for continuation toward 7,625.
Until price confirms outside the 7,655–7,714 range, I’m staying patient and avoiding entries in the middle.
Not financial advice. No confirmation, no trade. CME_MINI:MESU2026  Long
Long
 Long
Long
 Long
Long
Bulls Win the 65K Battle. Next Stop 78K.Hi traders! ☀️🌴🧠
At this point, the consolidation within the 60–65K range has ended with a clear shift in momentum toward the bulls 🦬🚀
In all my posts over the past few months, I’ve highlighted the importance of the 65K level, so I hope this breakout didn’t catch you off guard.
“The bullish scenario, with upside targets at 67K and 67.6K, will only come back into play if Bitcoin manages to reclaim 65K and, more importantly, hold above it.”
It was practically impossible to predict exactly when this impulse would happen or what its final targets would be. However, one thing was clear: once the breakout occurred and proved to be a true breakout rather than another false wick, like the ones we had seen repeatedly over the past few months, the bears were going to be in serious trouble ⚰️🐻⚰️🐻🔪
And that is exactly what happened.
Nearly $3B in positions were liquidated over the past 24 hours:
🔴 Total liquidations: $2.99B
🔴 Short liquidations: $2.74B
🔴 Bitcoin liquidations: $1.42B
To be fair, if the 60,000 level had broken to the downside, we would have seen a similar liquidation event, but this time affecting long positions. However, this time the scales tipped in favor of the bulls.
Since the breakout above 65K activated our bullish scenario, and both intermediate targets — 67K ✅ and 67.6K ✅ — have already been reached, I’m highlighting the next horizontal resistance levels on the chart.
These are not new levels. They are important historical levels that have been present on all of my charts since the correction from 126K began.
Each of these levels could either temporarily slow the move down or send Bitcoin into another consolidation 🛡️🛡️🛡️
🦬🚀However, considering the length of the accumulation within the 60–65K range and the structure of this breakout, I expect the move to continue toward 78K.
🐻🪓The bearish scenario is still on the table as well.
It could be activated if Bitcoin fails to establish itself above 70K. In that case, a retest of 67.6K and even 65K would be possible.
For now, however, I consider this scenario unlikely.
Good luck everyone! And regardless of how things develop from here, today I want to congratulate the bulls on this big victory 🎯✊🏼🦬
⚠️ Disclaimer:
All information shared on this channel is for educational and informational purposes only and is not investment advice. The author is not responsible for your trading decisions. Always manage your risks and make decisions independently. Long 
Short 
Gold Bullish Breakout — 4600 in FocusGold (XAU/USD) has broken out of a multi-day consolidation range with strong bullish momentum. The range resistance has been cleared, turning the previous resistance area into a potential support zone.
With today’s FOMC minutes and major U.S. political/news flow, volatility could increase significantly. If bullish momentum continues and price holds above the breakout/FVG area, 4,600 becomes the key upside target.
Target: 4,600
Key support: 4,430–4,435 area
TP1: 4,550
TP2: 4,575
TP3: 4,600 Long 
MESU Aug 19: Bounce Toward 7760–7780 or Break 7700?MESU remains inside a broader pullback structure, but there is still room for a short-term bounce into the fair value gaps above.
The first upside area I’m watching begins around 7,742, with 7,760 as the first continuation target if buyers regain momentum. Above that, the larger fair value gap around 7,780 remains in play.
On the downside, 7,700 is my key intraday breakdown level. A confirmed 15-minute close below 7,700 could open the door toward the higher-time-frame fair value gap around 7,682.
Key levels
7,740–7,742 — bullish trigger / first FVG area
7,760 — first upside target
7,780 — higher upside FVG target
7,700 — bearish trigger
7,682 — major downside target
Bullish scenario: Confirmed break above 7,740 → target 7,760 → possible extension toward 7,780.
Bearish scenario: Confirmed break below 7,700 → target 7,682.
For now, I’m staying patient between the trigger levels and waiting for price to confirm direction.
Not financial advice. No confirmation, no trade. CME_MINI:MESU2026 Long 
Long 
USDCHF: Breakout at the range top before PPI?📊 USDCHF: Breakout at the Range Top Before PPI?
USDCHF is testing the upper boundary of its recent range near 0.8138-0.8140.
Price has already bounced strongly from the 0.8055-0.8060 support area and is now pressing into the same resistance zone that capped previous upside attempts. This makes the current level important: either buyers confirm a breakout, or the pair rejects again back into the range.
The timing matters because the next U.S. inflation catalyst is PPI on Thursday, Aug 13 at 12:30 UTC. Weekly jobless claims are also due at the same time. If PPI comes in hotter, USD may get support and USDCHF could try to break above the range. If PPI is softer, the dollar may lose momentum and the pair could reject from resistance.
Indicators are supportive, but slightly stretched. RSI is around 65, showing bullish momentum, while MACD is positive. Price is also above EMA9, EMA20, SMA50 and SMA200, so the short-term structure favors buyers unless the breakout fails.
Bullish: a clean hold above 0.8140 could open the way toward 0.8150, then 0.8160-0.8170.
Rejection: if USDCHF fails below 0.8140, price may return toward 0.8120, then 0.8100.
Bearish shift: below 0.8095-0.8100, the breakout attempt weakens and the pair can move back toward 0.8060.
⚠️ Not financial advice.  Short
Short
 Long
Long