SDL NZ On medium to long term buy watchlistCurrently in a restructure, small cap stock with good fundamentals i.e. profitable and current ration of 2.0
is a software based company so has the ability to scale quickly without large investment
Will be eyeing up a position around $0.42, with first target around $1.50 and possible exit around $2.45
This is a monthly chart so is a long term trade...
Option B could be sell enough to get original money back at $1.50 and reinvest elsewhere while holding the rest till $2.45 to cash in
Shark
VodaFone Idea - Bottom made and ready for potential of 20 On a Monthly time Frame Vodafine Idea has touched bottom channel & along with that it has formed Bullish Shark pattern as well.
It will have next resistance at 13 (0.5 Fib). Monthly candle close above 13 will take it to 20.
Vodafone Idea is buy for 1 to 1.5 year time period for following targets.
13 - 20 - 23 - 26
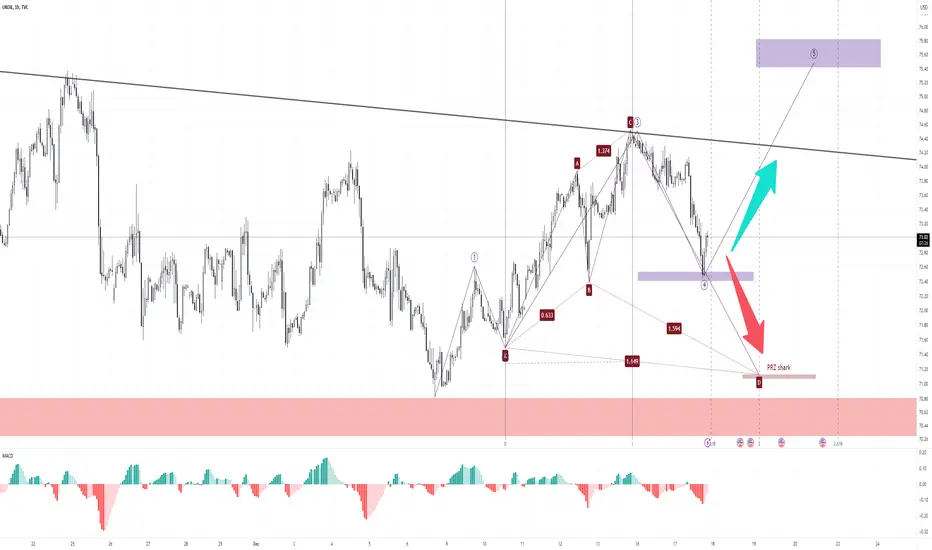
Oil next MovementOil competed the 4th wave of Elliot and moved upward exactly on wave 4 PRZ (Price reversal Zone). meanwhile the shark pattern is completed.
in case if Oil start to complete the wave 5 of Elliot the target price is shown and in case if the price reject the wave 4 PRZ downward, the shark PRZ also is been shown which can be a area to change the price process.
Thanks for comment and boost
AVAX/USDT - Bearish harmonic shark formation is loadingAVAX/USDT- update- the time to be careful is approaching for a bearish harmonic shark formation
The price continues to rise towards the channel middle band in the high time frame and this region intersects with the reversal region of the shark harmonic formation. In this case, the price is now gradually moving away from the 5-0 long direction region between 30-34. We can now talk about a correction for Avax between $59.94-$71.61. Of course, it would be appropriate to look for confirmation in l
Bitcoin Dominance: Elliott Wave and Harmonics ComboBitcoin Dominance ( BTC.D) is giving a fantastic trading setup.
It's preparing a BIG Bullish Swing.
From an Elliott Wave point of view, a bullish Impulse Wave is about to start.
In this case I'm talking about Super-Cycle (C) (turquoise).
Moving on to Harmonic Patterns, there are two:
The smaller one is the Bullish Shark, which is preparing its completion.
The second one, and the bigger view, is the Cypher Pattern, which will commence one the Shark is done.
So, bottom line: BTC.D is gonna sta
HARROW 16% INTRADAY DROP CAUGHT!Technical Analysis: HARROW (15-Minute Timeframe)
This chart demonstrates a highly profitable short trade executed with precision using the Risological Indicator. A stellar 16% profit was captured in this intraday trade, showcasing the power of momentum trading.
Trade Details
Stock: HARROW
Timeframe : 15-Minute
Entry Price : $52
Exit Price : $43
Profit : $9 per share (16% intraday return)
Key Technical Observations
Perfect Entry Point:
The entry at $52 aligns with the beginn
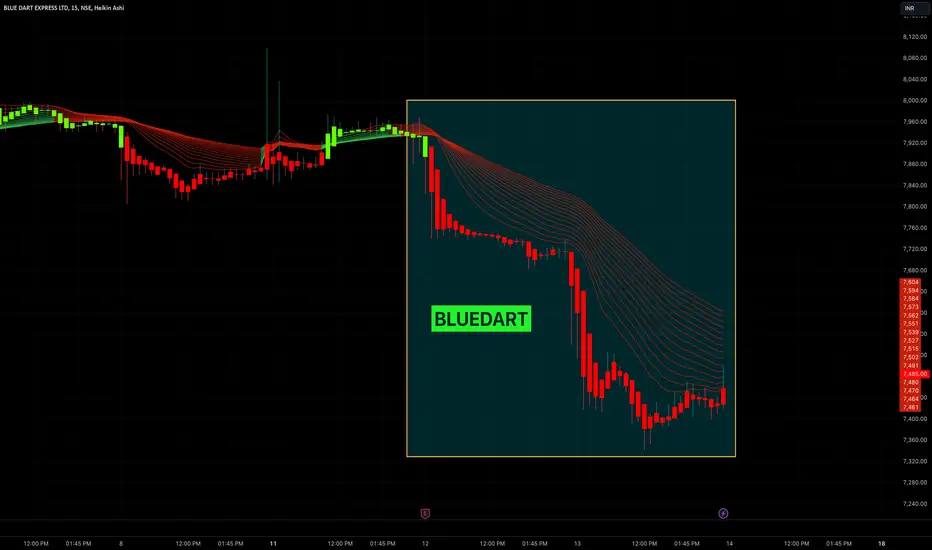
BLUEDART SHORT CAUGHT!Today was a one side, short market!
I always believe in following the money - the smart money!
Coupled with the options Weekly contracts termination like BANKNIFTY, MIDCPNIFTY, FINNIFTY, etc, we are going to see more sell off in this week, as per my observation.
Dont go LONG in the market blindly tomorrow ( 14, Nov, 2024).
Good luck and Namaste!
BTC Shark to 5-0 PatternBitcoin is currently in a weekly Shark pattern, suggesting a potential pullback to complete the 5-0 pattern. We could see a move towards the T1 zone at $45,703 - $43,000.
5-0 Pattern: This pattern often follows the Shark pattern and indicates the completion of a corrective move after the initial reversal. The 5-0 pattern has a distinct structure, starting from the end of the Shark pattern and typically leading to a trend continuation after a brief consolidation or retracement.
The last wick to
Syengene Forming Shark pattern (Bearish Mode)Syengene has formed bearish Shark pattern on weekly time frame
776 is an important support at 0.5 Fib. Immediate target at 776.
If it closes below 776 on week candle, then rest target to follow and could go down more till 400.
Target1 - 776
Target2 & 3 - 736 / 680
Target4 & 5 - 515 / 400
SShort
DXY (US Dollar Index) Analysis Daily TimeframeDXY is currently sitting at a daily resistance level after a bullish run since last week.
we anticipate a potential move to the downside as the index shows signs of weakening, by creating a Doji candlestick, which indicates market indecision.
Remember: If the US Dollar Index turns bearish, EUR/USD and GBP/USD are likely to show bullish momentum.
Let's take a closer look at these pairs for potential buy setups.