XAUUSD: Support Holds as Liquidity Builds Above 4,440🔹 XAUUSD is showing a broader corrective structure after the previous decline, with price recently consolidating above the highlighted support zone around 4,230–4,270. The descending trendline continues to define the recent market structure, while price action near 4,320 suggests a short-term attempt to recover. The 4,440 area remains a notable resistance and liquidity zone, where a breakout or rejection could provide further clues about the next directional move. Overall, the chart reflects a developing range between support and resistance, with liquidity positioned above recent highs.
🔸 If price continues to hold the support area, a bullish scenario could develop toward the upper liquidity zone, particularly if a breakout above nearby resistance is confirmed through sustained price action. Traders may wait for clear confirmation before considering any trade. Conversely, if the key support zone fails, price could revisit lower levels as bearish structure gains further confirmation. This XAUUSD technical analysis focuses on price action, market structure, support, resistance, breakout, and liquidity.
This analysis is for educational purposes only and does not constitute financial or investment advice. Always conduct your own research before making trading decisions.  Long
Long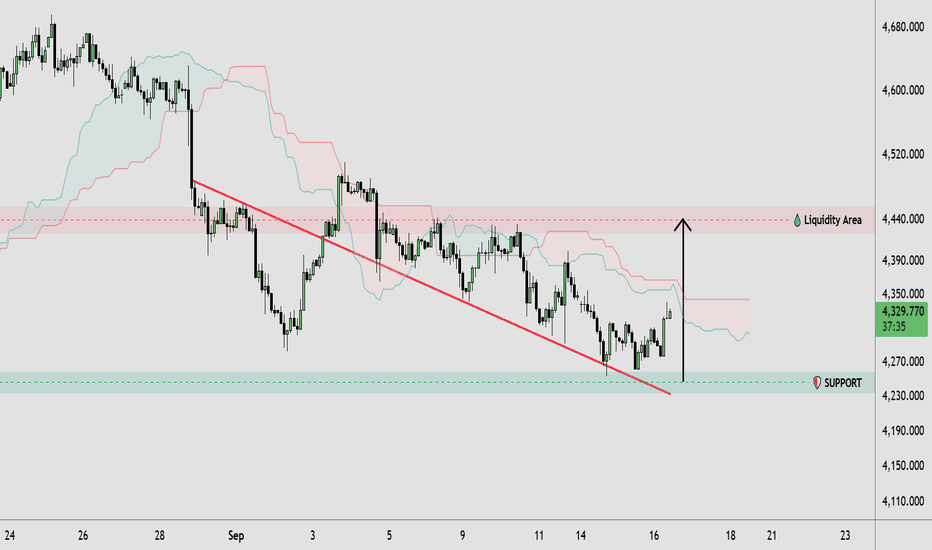
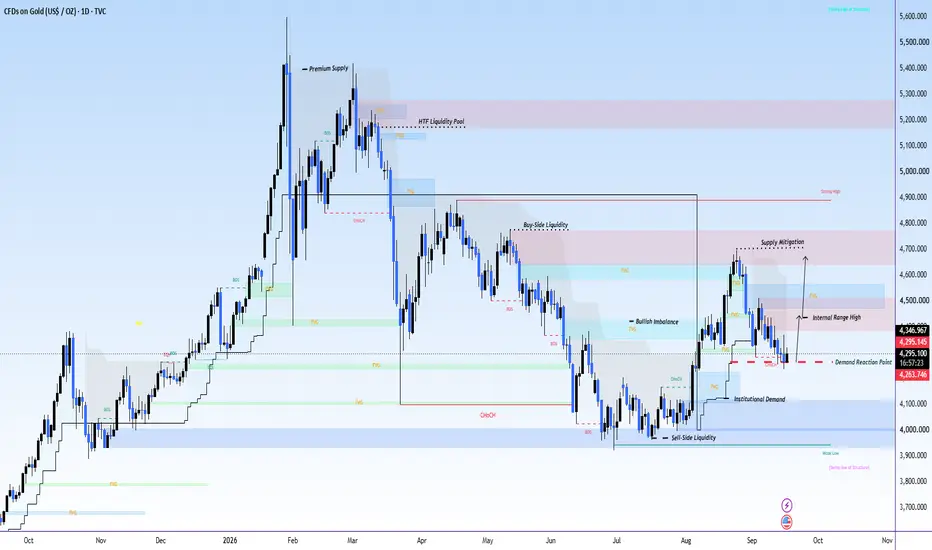
GOLD Daily| SMC Institutional Demand Mitigation& setup ExpansionGOLD Daily | Smart Money Concepts (SMC) Institutional Demand Mitigation & setup Expansion
1. Premium Supply Distribution & Macro Highs (~5,400+)
Price reached the macro higher-timeframe Premium Supply zone, leaving dramatic upper rejection wicks followed by strong bearish displacement candles.
Reason: Institutional sellers absorbed lingering buyer momentum at peak liquidity, initiating macro distribution and marking the top of the overall market structure.
2. bearish-Side Liquidity (SSL) Run into Institutional Demand (~3,950 – 4,000)
Extended downside expansion candles swept clean bearish-Side Liquidity (SSL) beneath key historical swing lows, driving price straight into the primary blue Institutional Demand block.
Reason: Smart money engineered a liquidity raid to trigger retail opposite side, gathering high-volume discount orders required for large-scale position accumulation.
3. Impulsive Bullish Displacement & Imbalance Creation (~4,100 – 4,500)
Consecutive long-bodied green expansion candles broke internal market structure to the upside (CHoCH/BOS), leaving wide Bullish Imbalance (FVG) pockets in their wake.
Reason: Aggressive institutional buying shifted market character, creating price inefficiencies and establishing buyer dominance across key timeframes.
4. Supply Mitigation & Local Retracement (~4,700 down to 4,293.359)
After hitting the upper Supply Mitigation block near 4,700, price printed a corrective sequence of lower-high and lower-low candles down to the Demand / Reaction Point (~4,293.359).
Reason: Market participants took profit near local supply, forcing a controlled pullback into discount FVG/demand zones to re-mitigate open bullish orders.
5. Current Demand Defense & Bullish Expansion Path (Arrow Path)
Recent candles show buyer absorption at current demand, projecting an upward run targeting the Internal Range High and higher supply levels.
Reason: Defense of key discount demand maintains the overall bullish structure, clearing path for bullish-side liquidity runs at overhead resistance. Long 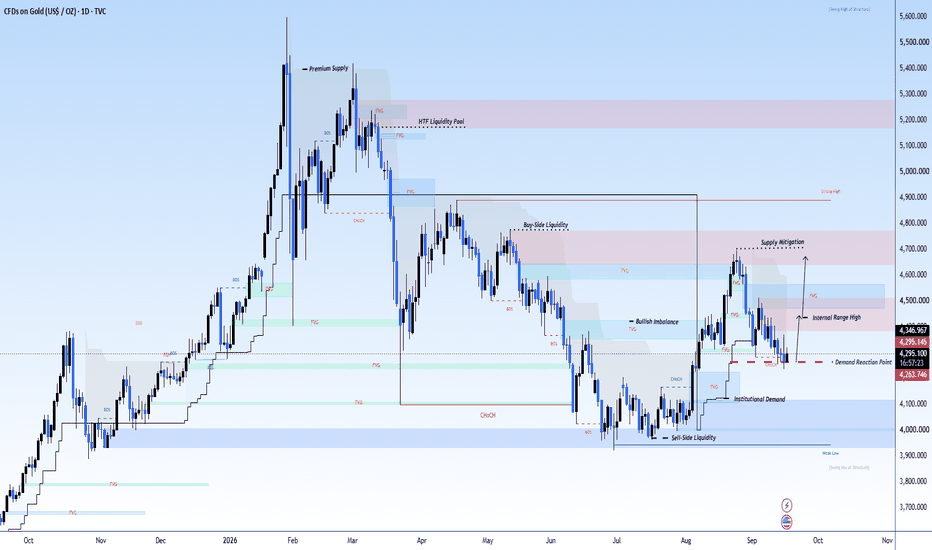
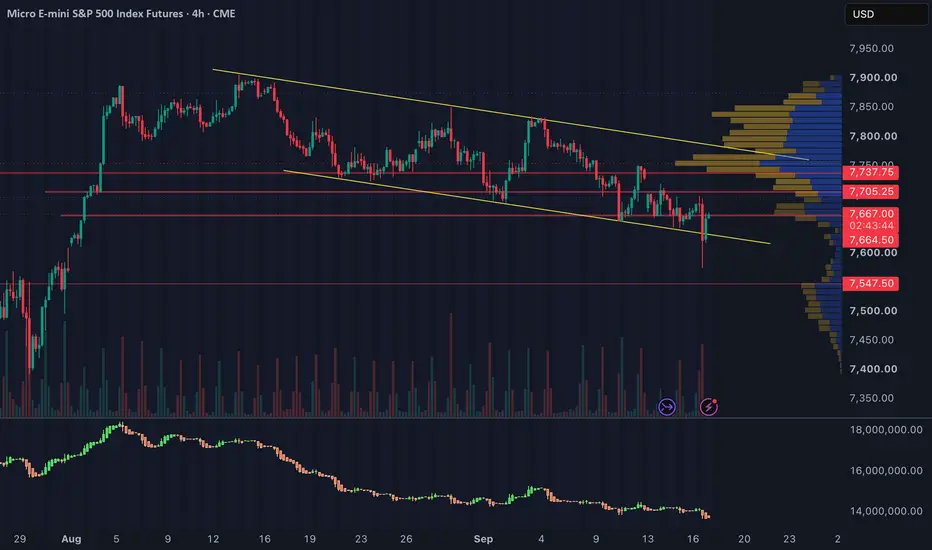
09/17/26 Ideas1. Preferred Short: Upper Repair-Band Failure
Location: 7,685–7,707.75
Setup: SR-with-retest progressing into Combination Confirmation
Ideal sequence:
MES trades into 7,685–7,707.75.
Buyers fail to establish acceptance.
Price breaks back below 7,685.
The recovery attempt into 7,685 fails.
Enter only after the failed reclaim, not on the initial touch.
This is the cleanest short location because it allows the post-FOMC rebound to reach meaningful resistance before asking sellers to prove themselves.
Targets: 7,666.50 → 7,655.75 → 7,634
Structural invalidation: Acceptance above 7,707.75, especially with broad improvement.
2. Nearer Short: Decision-Zone Failure
Location: 7,666.50–7,685
Setup: Combination Confirmation
Ideal sequence:
MES rejects 7,666.50–7,685.
Price loses 7,655.75.
The retest of 7,655.75–7,666.50 fails from underneath.
Sellers then receive permission to target 7,634.
This is valid but slightly less attractive than the higher short because current price is already inside this decision area. We need separation from the zone before entering.
Targets: 7,634 → 7,578.50
Invalidation: Recovery and sustained acceptance above 7,685.
3. Best Continuation Short
Location: Below 7,634
Setup: Break & Retest
Ideal sequence:
MES breaks 7,634 decisively.
Do not chase the first flush.
Price returns to 7,634 from below.
The level rejects the reclaim.
Enter on renewed downside expansion.
Targets: Post-FOMC low/approximately 7,600 → 7,578.50
Invalidation: Reclaim and sustained hold above 7,634.
This becomes much stronger if volatility firms and breadth deteriorates during the retest.
4. Best Bullish Repair Setup
Location: Above 7,685
Setup: Break & Retest long
Ideal sequence:
MES accepts above 7,685, not merely wicks through it.
Price pulls back into 7,666.50–7,685.
Buyers defend the former resistance zone.
Price expands away from the retest.
Targets: 7,707.75 → 7,728.50 → 7,740.25
Invalidation: Loss of 7,666.50, with a deeper failure below 7,655.75.
This is the setup that would challenge the tactical risk-off thesis. We should not remain married to the short if the repair receives broad confirmation.
5. Failed-Breakdown Reversal
Location: 7,634
Setup: Breakdown failure + reclaim/retest
Ideal sequence:
MES breaks beneath 7,634.
Volatility and breadth fail to confirm.
Price quickly reclaims 7,634.
A retest holds above it.
That would suggest sellers could not produce acceptance below the breakdown level.
Targets: 7,655.75 → 7,666.50 → 7,685
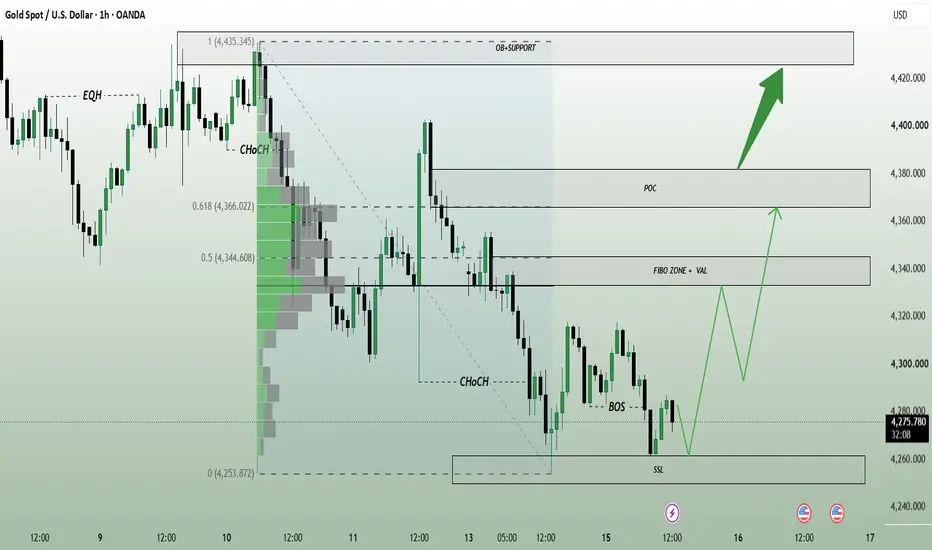
Invalidation: Renewed acceptance below 7,634. SSL Sweep Before Recovery WaveSSL Sweep Before Recovery Wave
Fundamental Analysis
Gold remains under pressure ahead of the September 16 Fed decision. Markets are pricing roughly a 94% chance of a 25 bp rate hike, while the U.S. 10-year yield has climbed above 5% and oil near $108 is reinforcing inflation concerns. These conditions continue to support the dollar and limit Gold’s recovery for now.
Technical Analysis
On H1, Gold remains in a bearish structure after the latest CHoCH and BOS, with price now near 4,284.
The key area is the 4,252–4,262 SSL. A final liquidity sweep into this zone could complete the bearish wave and create a cleaner base for recovery.
If buyers confirm from SSL, the first upside reaction area is the 4,332–4,346 Fibo Zone + VAL, followed by the 4,366–4,382 POC.
Important Key Levels
4,425–4,438 — OB + Support / Major Resistance
4,366–4,382 — POC
4,332–4,346 — Fibo Zone + VAL
4,252–4,262 — SSL / Main Liquidity
Trading Scenario
Buy priority comes only after a sweep into 4,252–4,262 followed by bullish H1 confirmation.
Target: 4,332–4,346 first, then 4,366–4,382.
Invalidation: H1 acceptance below the SSL zone.
Overall View
The H1 trend is still bearish, so buying early is less attractive. The cleaner setup is to let Gold take lower liquidity first, then watch for a confirmed recovery toward the Fibo Zone and POC.
Will Gold sweep the SSL before starting the next recovery wave? Long 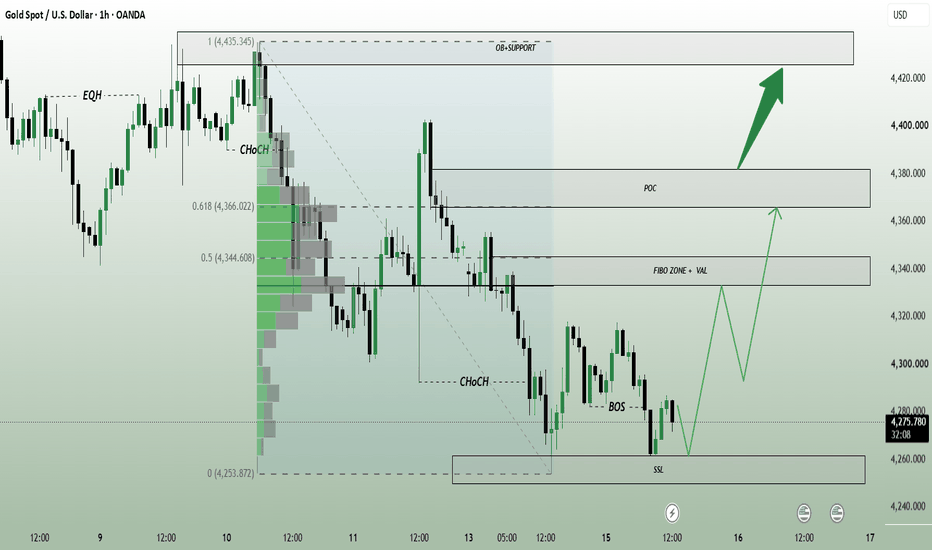
XAUUSD — Bullish Recovery After the PullbackMarket Pulse
Gold is recovering ahead of the Fed decision as the U.S. dollar, Treasury yields and oil prices ease.
A 25 bp rate hike is largely expected, so the bigger reaction may come from the Fed’s guidance. This could keep Gold volatile around the announcement.
What the Chart Says
XAUUSD is showing a stronger short-term recovery on H1.
Price has climbed from the 4,270 area and is now holding around 4,340, after breaking back above previous short-term structure.
The nearest support sits around 4,330–4,340. If this area holds, buyers may try to continue the recovery.
The next resistance is around 4,345–4,355. A clean move above this zone could open the way toward the stronger 4,395–4,405 resistance area.
A deeper pullback could still reach 4,300–4,320, which remains the stronger demand zone below.
Levels That Matter
4,395–4,405 — Main upside resistance
4,345–4,355 — First resistance
4,330–4,340 — Near-term support
4,300–4,320 — Main demand zone
4,270–4,280 — Recent swing support
My Main Plan
The main plan is bullish.
I prefer waiting for price to hold above 4,330–4,340 or make a controlled pullback toward 4,300–4,320.
If buyers return with clear confirmation, Gold could first challenge 4,345–4,355.
A clean breakout above that area may extend the recovery toward 4,395–4,405.
What I Need to See
I want to see the current recovery keep forming higher lows and price hold above the marked support structure.
A sustained H1 move below 4,300 would weaken the immediate bullish setup.
Final Read
The short-term H1 picture is improving, but Gold is approaching resistance just before the Fed decision.
For now, I prefer waiting for a pullback and bullish confirmation rather than chasing the move higher, with 4,395–4,405 remaining the main recovery target. Long 
XAUUSD — Bullish Retest Ahead of the FedFundamental Analysis
Gold is recovering ahead of today’s Fed decision as the U.S. dollar softens, Treasury yields retreat and oil prices ease. Markets currently price roughly a 92%–93% probability of a 25 bp hike, which would lift the target range to 3.75%–4.00%. With the hike largely priced in, the bigger reaction may come from the Fed’s guidance and outlook for further tightening.
Brent has eased toward $108 as Saudi Arabia offers additional crude via Oman and U.S. inventories rise, temporarily reducing some inflation pressure.
Technical Analysis
On H1, XAUUSD is trading near 4,348 after a strong rebound from the 4,268–4,280 demand area.
Price is now testing the descending resistance trendline and the 4,341–4,353 Fibonacci 0.786–0.618 zone. This area is the key short-term decision point.
If buyers defend the zone and price confirms a breakout/reclaim above the trendline, the next objectives sit near 4,368, followed by 4,378–4,394.
The 4,327 structure low remains the critical bullish invalidation level.
Important Key Levels
4,378–4,394 — Main target zone
4,368 — Intermediate resistance
4,341–4,353 — Main buy zone
4,327 — Key support / invalidation
4,295–4,315 — Deeper demand
Trading Scenario
Main Buy Setup
Entry: 4,341–4,353
Stop Loss: 4,324
Take Profit 1: 4,368
Take Profit 2: 4,378
Take Profit 3: 4,390–4,394
Buy Condition
Wait for the 4,341–4,353 zone to hold with bullish confirmation. A liquidity sweep, bullish engulfing candle, strong H1 reclaim, or confirmed break above the descending trendline would strengthen the setup.
A sustained H1 break below 4,327 invalidates the immediate bullish scenario.
Overall View
The short-term H1 structure is shifting toward recovery, but price is still confronting the major descending trendline. The preferred plan is to buy only after confirmation around 4,341–4,353, targeting 4,368 and 4,378–4,394.
With the Fed hike largely priced in, forward guidance may matter more than the rate decision itself for the next major Gold move.
Will Gold hold 4,341–4,353 and break the trendline before the Fed decision? Long 
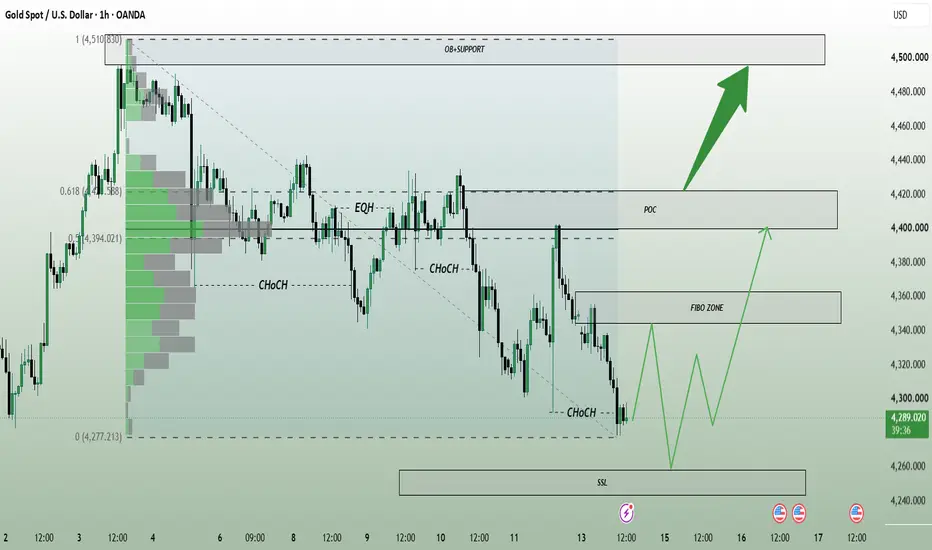
SSL Sweep Before RecoveryFundamental Analysis
Gold remains under pressure ahead of the Fed meeting on September 15–16. Markets are pricing roughly an 89% probability of a 25 bp rate hike, while the U.S. dollar has reached a one-week high and the 10-year Treasury yield is near 5%. Brent above $107 is also keeping inflation concerns elevated. Middle East tensions still provide some safe-haven support, but the macro environment remains difficult for Gold in the short term.
Technical Analysis
On H1, Gold remains in a bearish structure after repeated CHoCH signals and lower lows.
Price is now trading near 4,296, close to the previous low around 4,277. The next important area is the 4,245–4,260 SSL, where a final liquidity sweep could complete the current bearish wave.
If buyers react strongly there, Gold may recover toward the 4,340–4,360 Fibo Zone, followed by the 4,400–4,420 POC.
Important Key Levels
4,490–4,510 — OB + Support / Major Resistance
4,400–4,420 — POC
4,340–4,360 — Fibo Zone
4,245–4,260 — SSL / Main Liquidity
Trading Scenario
Buy priority comes only after a sweep into 4,245–4,260 followed by bullish H1 confirmation.
Target: 4,340–4,360 first, then 4,400–4,420.
Invalidation: H1 acceptance below the SSL zone.
Overall View
The H1 structure remains bearish, so buying early is less attractive. The cleaner setup is to wait for lower liquidity to be taken before looking for a recovery wave.
Will Gold sweep the SSL first before recovering toward 4,400? Long 
XAUUSD UpsideFirst, after the recent sell-off, XAUUSD transitions into range behavior.
The bearish momentum starts to slow, and instead of continuing lower, price moves back and forth around the lows, gradually building a base.
Now focus on the key zone around 4,300–4,315 marked on the chart.
This area has been containing price during the consolidation, making it an important short-term barrier for buyers.
This time, however, price approaches the zone differently. The move higher becomes more aggressive and concentrated , and buying pressure starts to build. Eventually, price pushes through the short-term descending structure and breaks above the range.
That breakout changes the immediate picture.
Instead of chasing the move, I would watch for price to pull back toward the breakout area . If 4,300–4,315 can hold as new support, it would suggest that previous resistance is beginning to flip into demand.
From there, buyers could regain momentum and extend the recovery toward 4,370 .
The key idea is simple: range → pressure builds → breakout → retest → continuation. Long 
XAUUSD: Facing Key ResistanceFollowing the latest rebound, XAUUSD is gradually moving back toward a key resistance area around 4,365–4,400, where the descending trendline and the Ichimoku Cloud converge. Selling pressure has repeatedly returned whenever price approaches this structure, creating a sequence of lower highs and keeping the broader bearish trend intact on the H4 timeframe. For now, the recovery still looks more like a technical rebound than the beginning of a new uptrend.
The area around 4,365 is particularly important. It sits directly beneath the descending trendline and close to the Ichimoku resistance zone, giving sellers a strong technical area to defend. If price is rejected again, bearish momentum could quickly return and push gold toward the 4,225 support area, as highlighted on the chart.
From a fundamental perspective, gold remains under pressure as hotter-than-expected U.S. inflation has strengthened expectations of a Fed rate hike, while Treasury yields remain elevated. With markets preparing for the Fed’s policy decision this week, higher-rate expectations continue to reduce the appeal of non-yielding assets such as gold.
Trading strategy: Prioritize SELL setups around 4,365 if bearish confirmation appears, with a target near 4,225. Short 
H1 Bearish Retest Toward Previous SupportXAUUSD is trading around 4,291 after another bearish leg pushed price back into the 4,275–4,295 Current Demand Zone. H1 structure remains bearish beneath the descending trendline, but price is now sitting near support, so chasing fresh shorts at current levels is less attractive.
The macro backdrop remains heavy for gold ahead of today’s Fed decision. Markets are pricing roughly a 90% probability of a 25 bp rate hike, while the U.S. dollar remains firm and Treasury yields recently reached their highest levels since 2007. Oil has eased slightly today but remains above $100, keeping inflation concerns elevated. The FOMC statement is due at 2:00 p.m. ET, followed by Chair Kevin Warsh’s press conference at 2:30 p.m. ET.
Technical View
The H1 structure continues to print lower highs and bearish structural breaks.
Price is currently reacting from the 4,275–4,295 demand zone, so a corrective rebound may develop before the next bearish leg.
The first important recovery area is around 4,335–4,360, but the cleaner sell location sits higher at the 4,375–4,390 Order Block, where the descending resistance structure also aligns.
If sellers defend this zone, the next downside objective is the 4,254 previous support.
Above that, 4,425–4,450 Supply remains the stronger resistance area, while 4,500–4,515 Major Supply is the higher-timeframe ceiling.
Key Zones
Current Price: 4,291.440
Current Demand: 4,275–4,295
Sell Priority / Order Block: 4,375–4,390
Supply Zone: 4,425–4,450
Major Supply: 4,500–4,515
Downside Target / Previous Support: 4,254.130
Trading Plan
Sell Priority: 4,375–4,390
Condition: wait for an H1 recovery into the Order Block followed by bearish rejection, failed acceptance or lower-high confirmation.
TP1: 4,300–4,285
TP2: 4,254
Invalidation: sustained H1 acceptance above the Order Block and descending resistance structure would weaken the immediate bearish setup.
Sell View
The preferred approach is not to chase shorts around 4,290 because price is already sitting inside demand.
A corrective recovery toward 4,375–4,390 would provide a cleaner location to evaluate seller response. With the Fed decision approaching, a liquidity sweep above nearby resistance remains possible before direction becomes clearer.
Final View
Gold remains bearish on H1, while the macro environment continues to favor higher rates, a firm dollar and elevated yields.
The main scenario is a rebound from current demand into 4,375–4,390, followed by renewed bearish continuation toward 4,254.
Will the Fed trigger the H1 retest into the bearish Order Block before gold attacks previous support? Short 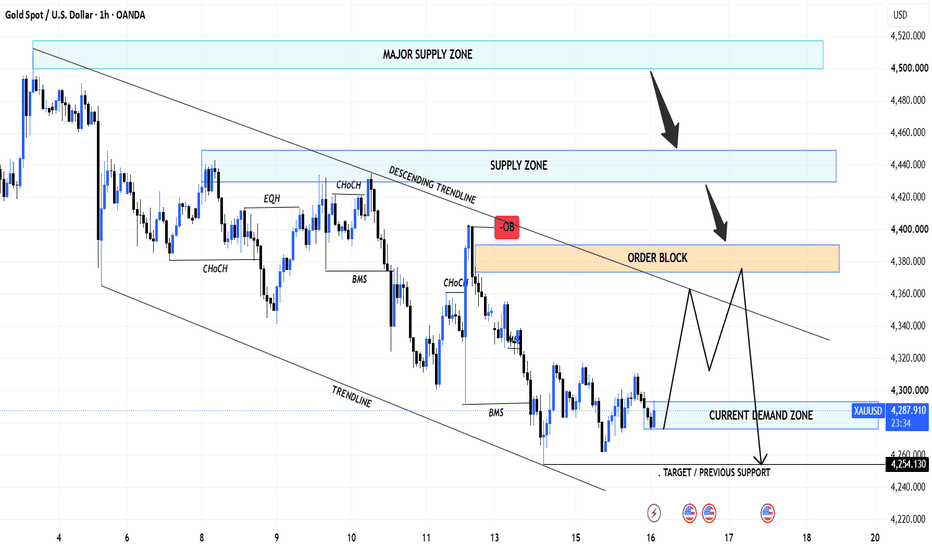
 Long
Long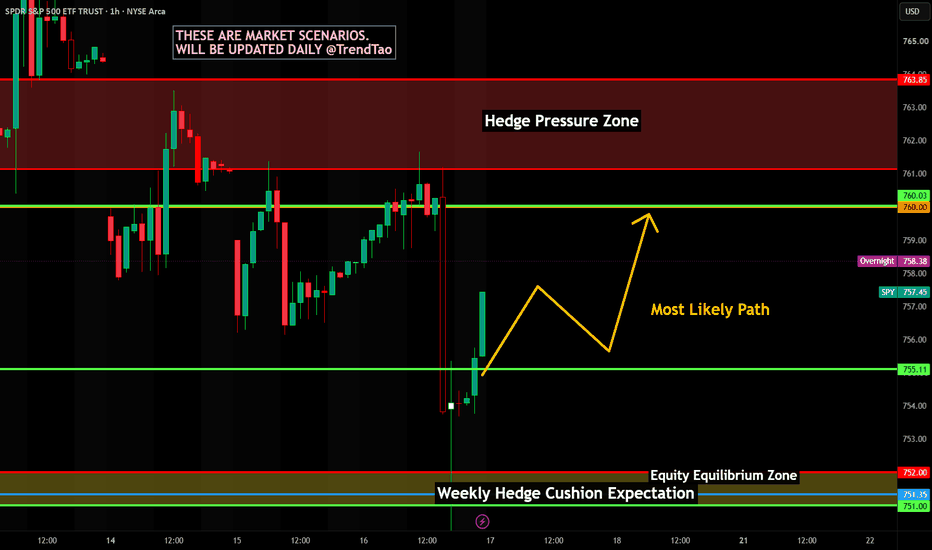
Brent Crude Oil | Is Wave III Expanding?⏱️ Reading time: About 2 minutes
In our previous oil analyses, the focus has always been on one simple question:
What structure is the market building?
On the 2H Brent chart, the move developing from the major low continues to show an impulsive character. Price has now reached an area where the structure may provide much more information about the higher-degree wave.
In the bullish scenario, the current advance could be part of a higher-degree Wave III. If so, the internal structures should continue developing progressively and impulsively, while a break above 105.80 could provide an important confirmation for this path.
If this behavior continues, 126.27, 139.46, 147.77, 160.76, and 182.16 are the key areas I will be watching as the higher-degree structure develops.
These are not guaranteed price forecasts. They are structural reference levels that can help us evaluate how the pattern evolves.
But there is still another path on the chart.
If the current advance fails to maintain its impulsive character and instead completes as a five-wave move followed by a larger sideways correction, the bearish / larger corrective structure becomes relevant again.
In that case, the market could develop a deeper correction while 58.52 remains the invalidation level for the larger bullish structure.
So the main question here is not:
“Will oil go up or down?”
It is:
“What structure is the market building next?”
Price does not always give us the answer immediately.
But structure reveals it step by step.
We just have to listen.
Patterns whisper. I listen.
— Mr. Nobody 🎧📊
WTI Oil Spot
Sep 2
Crude Oil | Three Nested Structures or a Larger Correction?
Brent Crude Oil
Aug 10
Crude Oil: Is a Larger Wave III Beginning?
CFDs on Crude Oil (Brent)
Aug 6
Is Wave 3 Beginning, or Is One More Correction Still Ahead?
 Long
Long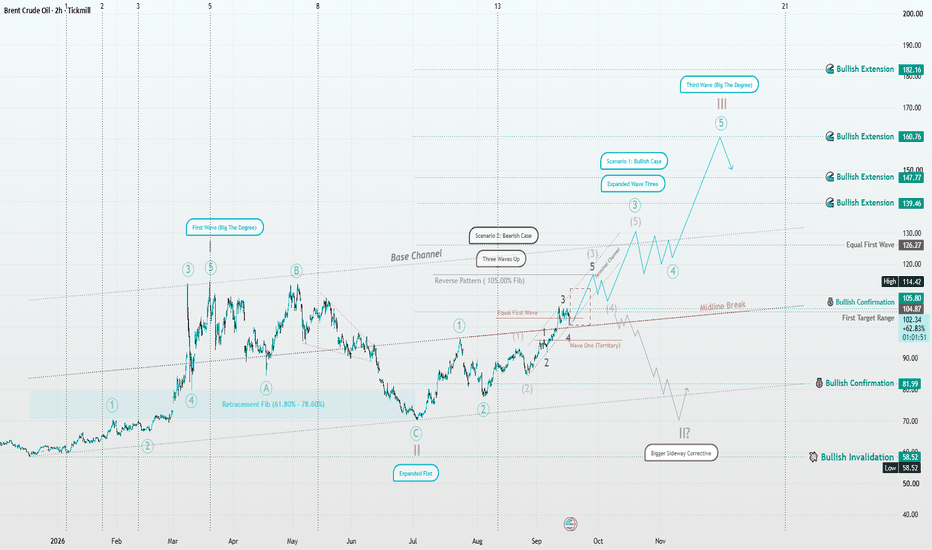
Silver | When Structure Speaks, We Listen⏱️ Reading time: about 3 minutes
In our previous Silver analyses, we focused on identifying the first motive wave to the upside from the recent low — a structure that could develop into a five-wave impulse. After the latest movement, the main question is no longer simply “up or down?” but rather what degree does the current correction belong to, and is it still developing or already complete?
🟦 Scenario 1 | Bullish Case
In this view, the initial bullish structure remains important. The recent decline may be part of a corrective structure, while the current movement could be building the next stage of that correction.
If the current correction develops as a sideways structure and price then breaks out with a clear motive pattern, the possibility of further upside becomes more relevant.
But for us, a simple move through a price level is not enough — the structure must prove itself.
If the next advance is truly a motive wave, we should also be able to recognize a clear and consistent structure at the smaller degree.
In that case, a break of the recent high followed by a correction proportional to the wave’s degree and character could provide more information about the next phase.
⬛ Scenario 2 | Bearish Case
In the conservative view, the recent decline may represent the first part of a larger corrective structure — potentially something similar to W within a zigzag or double zigzag.
The current advance could therefore be a connecting or corrective wave, such as X, or part of a larger B wave.
If this advance fails to develop into a valid motive structure and price then declines with strength again, a deeper corrective structure becomes possible. Another zigzag could develop, eventually completing Y.
In that case, the larger decline would still be part of the same higher-degree corrective wave.
🔎 The Key Point
At this stage, both structures remain under observation, and the type of structure itself may still change. That is why every new price action requires a fresh review.
We are not deciding the future path in advance.
We wait for the market to show us whether the current movement can develop into a motive wave, or whether it will ultimately prove to be part of a more complex corrective structure.
Patterns whisper; I listen.
— Mr. Nobody 🎧📊
Silver / U.S. Dollar
Sep 6
Silver 4H | The Structure Is Speaking — Elliott Wave Update
Sep 2
Silver | Let the Waves Speak
XAUUSD — Bearish Trend, Waiting for the PullbackMarket Pulse
Gold remains under pressure ahead of the Fed decision.
Higher Treasury yields, a firmer U.S. dollar and strong rate-hike expectations continue to limit the upside. High oil prices are also keeping inflation concerns alive, so volatility may stay elevated.
What the Chart Says
XAUUSD remains bearish on H1.
Price continues to form lower highs and lower lows, while the latest breakdown has pushed Gold back toward the lower support structure around 4,255–4,265.
The current price near 4,283 is already close to support, so I would not chase fresh shorts here.
A corrective rebound could first reach 4,307–4,318, which is the nearest broken structure and first resistance.
If price recovers further, the more important area sits around 4,345–4,357. This is the main rejection zone on the chart and a cleaner place to watch for sellers to return.
If that area holds, another bearish wave could develop toward 4,255–4,265, followed by the deeper 4,225–4,240 demand zone.
Levels That Matter
4,425–4,435 — Major upper resistance
4,345–4,357 — Main rejection area
4,307–4,318 — First resistance
4,255–4,265 — Support zone
4,225–4,240 — Main demand zone
My Main Plan
The main plan remains bearish.
I prefer waiting for price to recover toward 4,307–4,318 first.
If the rebound becomes stronger, 4,345–4,357 is the better sell area to watch.
A clear bearish reaction from resistance could bring Gold back toward 4,255–4,265 and later the deeper demand zone.
What I Need to See
I want the rebound to form another lower high and fail below the marked resistance areas.
A sustained H1 move above 4,357 would weaken the immediate bearish setup. A stronger recovery above the major upper resistance would suggest a larger structure change.
Final Read
The H1 trend still favors sellers, but price is already near support.
For now, I prefer waiting for the pullback and selling from resistance rather than chasing the move lower, especially with the Fed decision likely to create sharp two-way volatility. Short 
BTC Broke 76,030 And Swept To 74,887.BTC Broke 76,030 And Swept To 74,887.
Bitcoin lost the range it had held all week, taking out 76,030 and running down to 74,887 - within about 700 of the 74,182 structural floor - before recovering to 76,027 this morning. That is the range break the last four sessions were building toward, and it resolved down. Price is now back at the level it broke, testing it from beneath. The 4H carries volatility at the 98th percentile of its range with a swept low and an active compression flag on the same bar, which is what the end of a fast move usually looks like rather than the middle of one. Neutral.
Resistance: 76,237 - the recent low, now overhead
Key resistance: 78,028 - the line that capped the range
Current price: 76,027
Support: 74,887 - this week's low
Key support: 74,182 - the structural floor
Structural floor: 73,571 - deeper support
Two paths from here:
It fails at 76,030 and works back toward the low. Rejection here confirms the broken range low as resistance and puts 74,887 back in play, and a close beneath that finally opens 74,182 - the level this structure has been pointing at since the highs failed.
It reclaims 76,237 and the break becomes a sweep. Getting back above the recent low would make the flush a liquidity grab rather than a trend leg, though the range does not actually repair until 78,028 is back overhead.
Both ends of this range have now been swept and the low end broke first. 76,030 decides whether that break holds.
Built with SYNTHESIS v3.3 | SOM / ACE / IMP / SYNTHESIS
Study, not financial advice. Long 
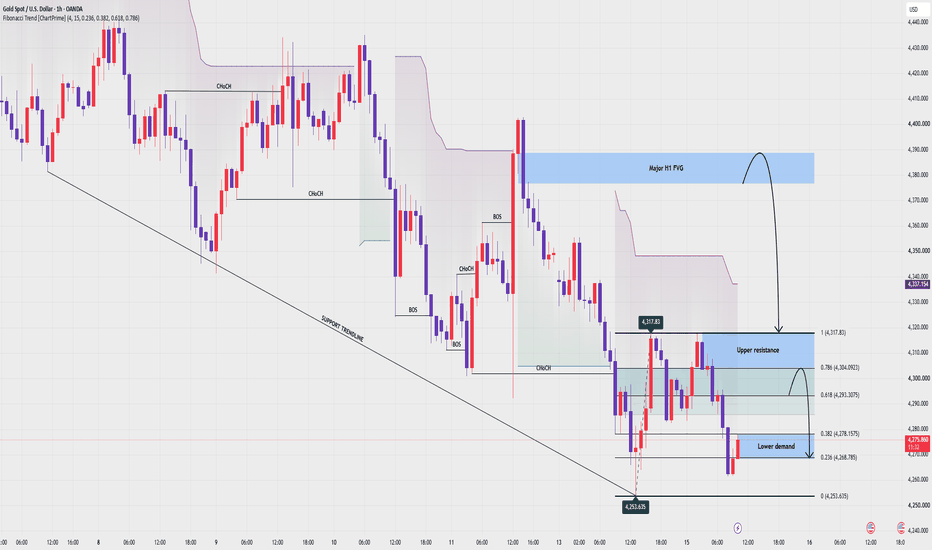
XAUUSD — Sell the H1 Fibonacci RetestFundamental Analysis
Gold remains under pressure ahead of the September 15–16 Fed meeting. Markets are pricing roughly a 92% probability of a 25 bp rate hike, while a firmer U.S. dollar and rising Treasury yields continue to raise the opportunity cost of holding gold.
The macro backdrop is also being complicated by oil prices above $100 and renewed Middle East supply concerns. U.S. Treasury yields have pushed to fresh multi-year highs, with the 10-year recently moving above 5%, reinforcing the higher-for-longer pressure on precious metals.
Technical Analysis
On the H1 chart, XAUUSD is trading near 4,277 after rebounding from the 4,253.64 low but failing to establish a sustained bullish structure.
Price remains below the broader bearish structure, while the latest Fibonacci retracement identifies 4,293–4,305 as the most attractive short-term sell area. This zone combines the 0.618–0.786 retracement, previous structure, and nearby H1 imbalance.
A deeper recovery could test 4,318, but acceptance above that level would weaken the immediate bearish setup.
If sellers defend the Fibonacci zone, price may rotate back toward 4,278, followed by 4,268–4,270 and eventually the 4,253–4,255 liquidity low.
Important Key Levels
4,378–4,390 — Major H1 FVG
4,305–4,318 — Upper resistance
4,293–4,305 — Main sell zone
4,278 — First downside pivot
4,268–4,270 — Lower demand
4,253–4,255 — Main liquidity target
Trading Scenario
Main Sell Setup
Entry: 4,293–4,305
Stop Loss: 4,322
Take Profit 1: 4,278
Take Profit 2: 4,268–4,270
Take Profit 3: 4,253–4,255
Sell Condition
Wait for price to retrace into 4,293–4,305 and show bearish confirmation. A rejection wick, bearish engulfing candle, failed reclaim above 4,305, or H1 close back below 4,293 may confirm renewed seller pressure.
A sustained break above 4,318–4,322 would invalidate the immediate sell idea.
Overall View
The H1 bias remains bearish while XAUUSD trades below 4,318. With price already near lower support, chasing shorts around 4,277 offers poor positioning. The preferred plan is to wait for a corrective rebound into 4,293–4,305, then look for confirmation toward 4,278, 4,268, and potentially a retest of the 4,253 liquidity low.
The Fed decision is now the main volatility risk, and the tone of the policy statement may be as important as the expected rate hike itself.
Do you expect gold to retest 4,293–4,305 before sellers attack 4,253 again? Short