Gold keeps hitting new highs, let’s see how I cope with it! Before updating my views, I would like to remind all my friends again: the market is always full of possibilities. There is no so-called "highest point", only higher possibilities. When the trend is clearly upward, going with the flow is the core strategy to achieve stable profits. Avoid trading against the trend or on an emotional basis, especially in the current volatile market environment. Trading without clear thinking and discipline can easily lead to unnecessary losses. For those who are still on the sidelines and haven't yet developed an effective trading strategy, please follow my channel. We will continue to provide professional market analysis, comprehensive trading plans, and precise buy and sell instructions to help you better grasp the market's rhythm.
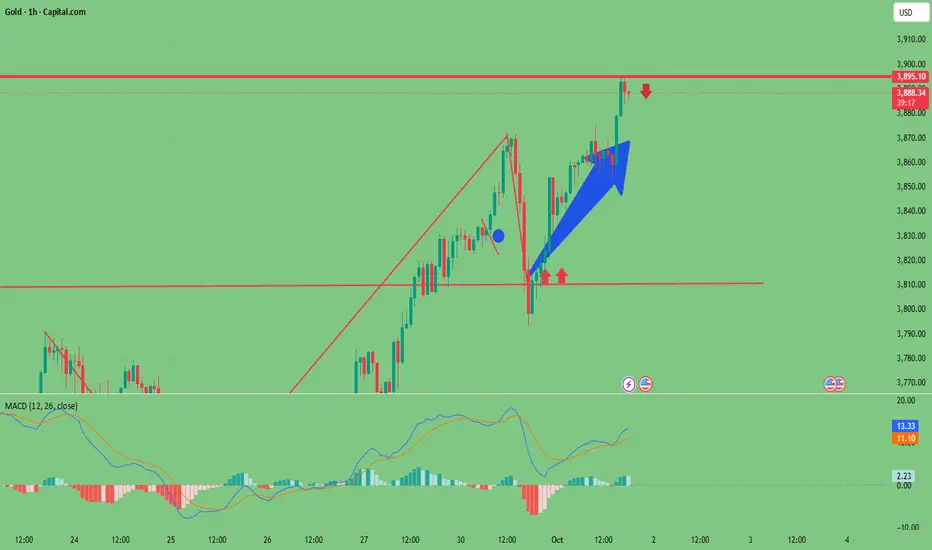
Every recent pullback in gold prices has shown the characteristics of consolidating the foundation for the rise, with highs continuing to move up and bulls significantly strengthened. The current price is once again approaching the key integer mark of 3900, which is the second important integer mark price this week and also the core area of the game between bulls and bears.
Despite the strong performance of bulls, from a technical perspective, there is pressure from profit-taking on buying orders and psychological suppression of integer levels. In the short term, the possibility of gold prices effectively stabilizing at 3,900 during the day is relatively limited. Even if the upward trend remains strong, the market still needs to accumulate energy through periodic pullbacks. Based on the current trend analysis, it is expected that the gold price may hit the 3900 mark again, and may even briefly break through this level before falling back.
Based on the above analysis, it is recommended that today's trading strategy can be to arrange short orders in the range of 3895 to 3905 by building positions in batches, and formulate a plan to cover positions in advance, while being alert to the risk of recurrence of short-term market wash-out.
The following are my personal opinions. If you agree, please like and follow me! If you have better trading ideas, you can also leave a message in the comment section to share them! Today's gold trading guide strategy! Please refer to it!The following are my personal opinions. If you agree, please like and follow me! If you have better trading ideas, you can also leave a message in the comment section to share them!
Having a clear trading idea is crucial in actual operations, especially at critical stages when
market conditions change. The current market is clearly showing signs of a temporary halt to
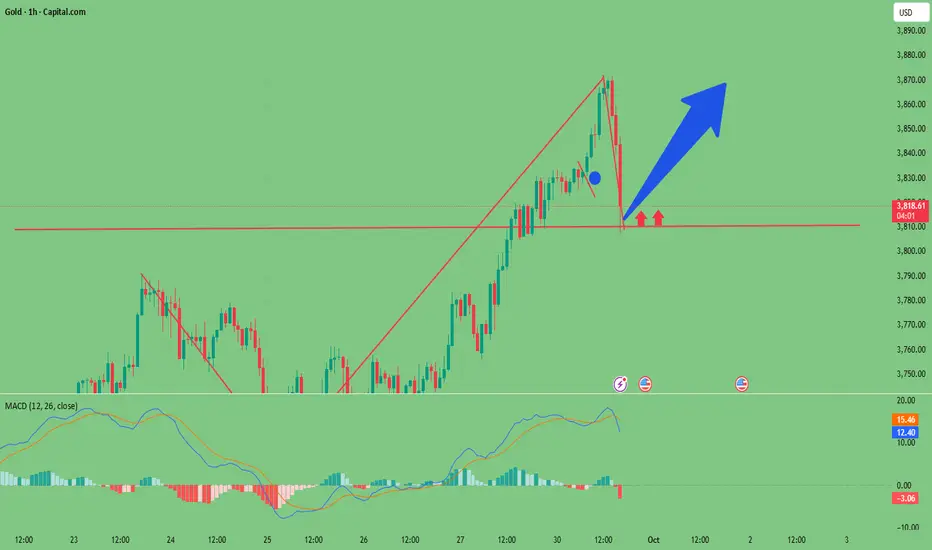
the unilateral upward trend. The previous upward momentum is gradually weakening, and trading volume has begun to shrink temporarily, indicating that bulls are digesting the previous gains. From the perspective of technical structure, the price has entered a relatively high consolidation area and lacks strong driving force for further breakthroughs in the short term. Therefore, it is expected to enter a large-scale range-bound consolidation pattern.
In this volatile market, market fluctuations are no longer one-way, but will run back and forth between certain support and pressure levels. While this trend lacks the explosive power of a trending market, it provides more opportunities for short-term and swing traders. Whether you are going long or short, as long as you can accurately judge the key positions and grasp the timing of entry and exit, you can achieve stable profits. In particular, placing long positions near support levels and short positions near resistance levels, combined with effective position management and stop-loss settings, often yields a high risk-reward ratio.
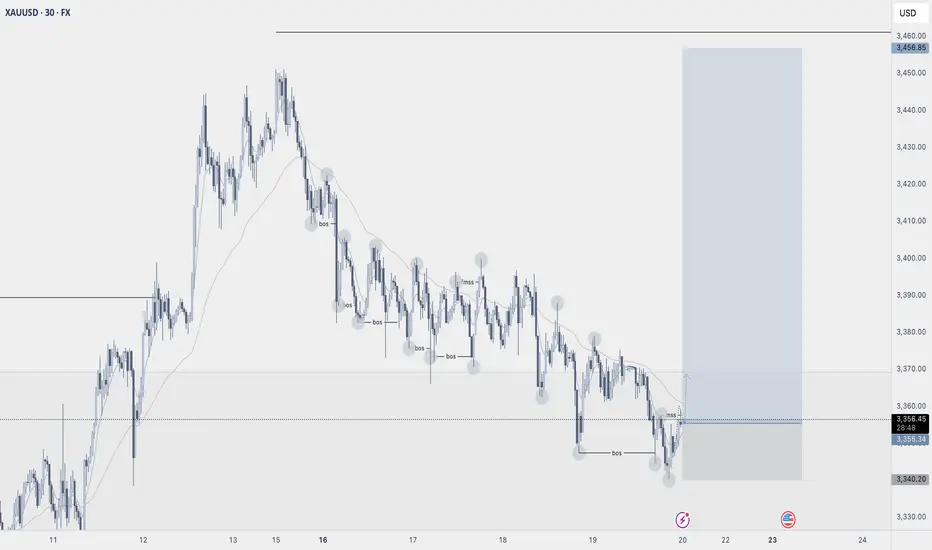
Trading strategy: You can open a long position at 3810, and increase your position between 3805 and 3800.
Overall, the current volatile market is not a disorderly fluctuation, but rather an accumulation of energy for the next stage of direction selection. For traders, this is precisely a rare "red envelope market" - as long as they remain patient, follow established strategies, and do not blindly chase rising and falling prices, they will have the opportunity to steadily accumulate profits amid fluctuations.  Long
Long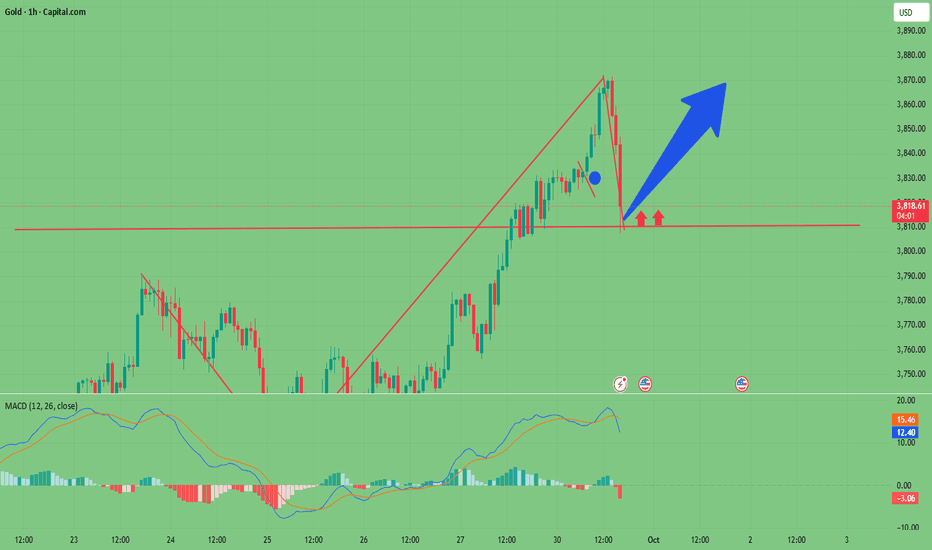
Gold may reach a new high, are you ready to go long?Before updating my views, I would like to remind all my friends again: the market is always full of possibilities. There is no so-called "highest point", only higher possibilities. When the trend is clearly upward, going with the flow is the core strategy to achieve stable profits. Avoid trading against the trend or on an emotional basis, especially in the current volatile market environment. Trading without clear thinking and discipline can easily lead to unnecessary losses. For those who are still on the sidelines and haven't yet developed an effective trading strategy, please follow my channel. We will continue to provide professional market analysis, comprehensive trading plans, and precise buy and sell instructions to help you better grasp the market's rhythm.
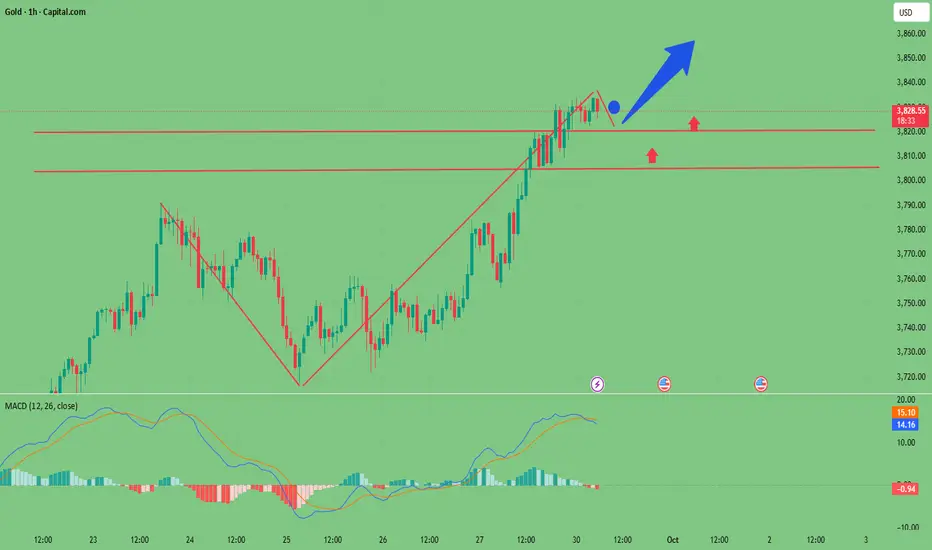
Looking back at the performance of the gold market on Monday, gold prices once again saw a strong rise, successfully breaking through multiple key integer levels and continuously setting new highs during the session. The overall trend almost perfectly replicated the strong pattern of last Monday. As I have emphasized many times during the trading session, the current market operating rhythm is highly referenceable, especially the continuity of technical forms and capital momentum is very obvious. Therefore, I recommend investors focus on historical trend similarities and use this as a key indicator for judging the current direction. In fact, last Monday's strategy of mainly buying on pullbacks has been fully verified by the market, and investors holding long positions at low levels have already reaped considerable profits. Looking ahead to today's market, I believe we can still refer to last Tuesday's trend path for positioning. From the current technical perspective, gold remains in a typical upward trend, with moving averages showing a bullish alignment, strong trading volume, and strong buying sentiment. Considering the macroeconomic environment, continued global demand for safe-haven assets, coupled with expectations of looser monetary policies in some economies, further supports the upward trend of precious metals. Therefore, I continue to hold a bullish view on today's gold price. I expect the price to hit a new high and the increase may further expand.
In terms of specific operating strategies, it is recommended that investors establish long positions in batches around 3820, control the position ratio, and avoid entering the market with heavy positions at one time. If there is a brief intraday pullback and the price falls back to the 3810 to 3805 range, it can be seen as an ideal opportunity to increase positions. This area is not only the support level of the previous intensive trading area, but also the golden section position of short-term technical pullback, with strong dual psychological and technical support. Once the price stabilizes and rebounds, the probability of an upward breakout will significantly increase.
It is important to note that although the current trend is strong, no market can rise unilaterally and indefinitely, and more attention should be paid to risk management when volatility intensifies. Be sure to set reasonable stop-loss protection to avoid losses caused by sudden news or drastic fluctuations in liquidity. At the same time, it's important to closely monitor potential influencing factors and adjust your position structure promptly.
In short, in a market with clear trends, maintaining patience and steadfastly executing your established strategy are the keys to success. Let's seize the opportunities presented by this gold rally, trade rationally, and move forward steadily. Long 
The 3800 mark has been broken, is it time to buy gold?In this round of rise, risks and opportunities coexist. As long as you follow the trend and plan your positions reasonably, it is not difficult to make profits from trading. Friends who encounter trading difficulties and trading losses should not panic. I have prepared detailed trading plans in the channel.
History often repeats itself, and the market keeps repeating itself. It was predicted in last week’s opinion that the key turning point may be this week. Sure enough, today's market opened with an uptick, with prices rising to around 3785 before gathering momentum. During this decline, I successfully took a short position and took profit. Gold prices subsequently stabilized in the 3770 area, allowing bulls to break through the 3800 mark and continue their upward trend.
What is strikingly similar to last week is that the same integer thresholds were completed on Mondays, and the market has been rising for several consecutive Mondays. In this case, after seeing the bulls stabilize, I did not hesitate to go long in the 3790 area. As for whether the gold bulls can be as rapid as last week, we still have to focus on whether the 3800 points in the New York session can be successfully stabilized! The opportunity for gold short position at 3780-3790 is hereThe gold market saw a slight rebound after opening today, indicating that bulls and bears are still in a game in the short term. Although prices have rebounded, the overall trend has not yet broken away from the previously formed range of fluctuations, indicating that market sentiment is relatively cautious. From a technical perspective, gold prices have recently attempted to rise many times but have failed to effectively break through the key resistance area, indicating that the selling pressure from above is still relatively obvious. Combining last week's trading performance, prices repeatedly encountered resistance and retreated within the 3775-3785 range, forming a relatively clear technical resistance zone and providing a valuable trading reference.
In this context, today's trading strategy can continue last week's overall thinking and maintain a judgment framework based on range fluctuations. If the gold price rebounds to the 3780 to 3790 area during the session and then shows signs of pressure again, such as a long upper shadow or insufficient trading volume, investors may consider establishing short positions in batches within this range and set reasonable stop-loss levels to control risks. At the same time, it is important to closely monitor the market's reaction to key economic data or macroeconomic policy developments, particularly changes in the US dollar index and US Treasury yields, as these factors will directly influence gold's short-term trend.
Furthermore, the market is currently at a critical stage of selecting a corrective direction. If prices effectively break through previous highs and stabilize above the range, this could trigger a surge in technical buying, necessitating timely adjustments to holding strategies. Conversely, if prices fall below the lower limit of the range, the downward trend could accelerate. Therefore, before a clear breakthrough signal appears, it is recommended to wait and see or adopt a high-selling and low-buying approach to avoid blindly chasing highs and selling lows. Overall, a cautious approach is recommended at this stage, combining technical indicators with market dynamics to respond flexibly and enhance trading discipline and success rates. Short 
Short 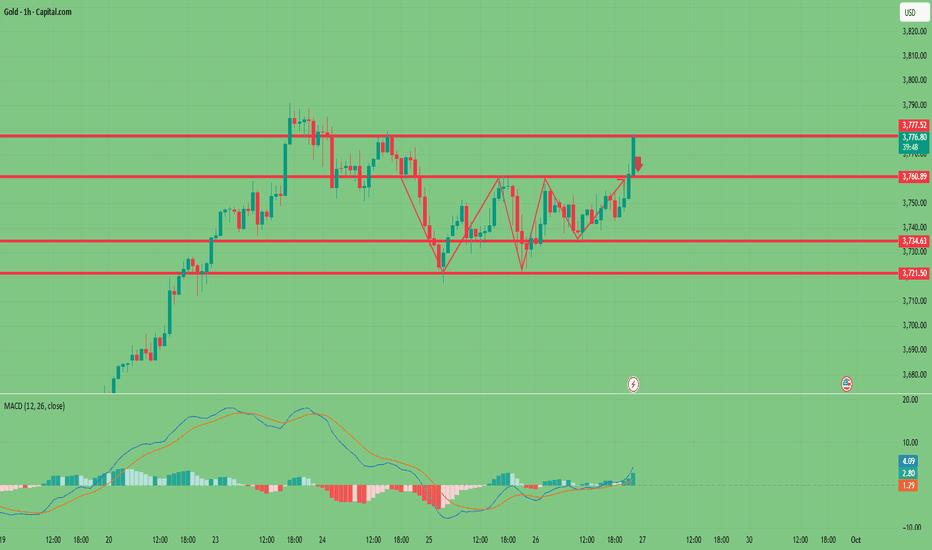
Gold may bottom out and rebound, are you ready to buy?Referring to the gold trend last week, the market performance in the first three trading days of this week was basically consistent with it, and today's market also continued similar operating characteristics.
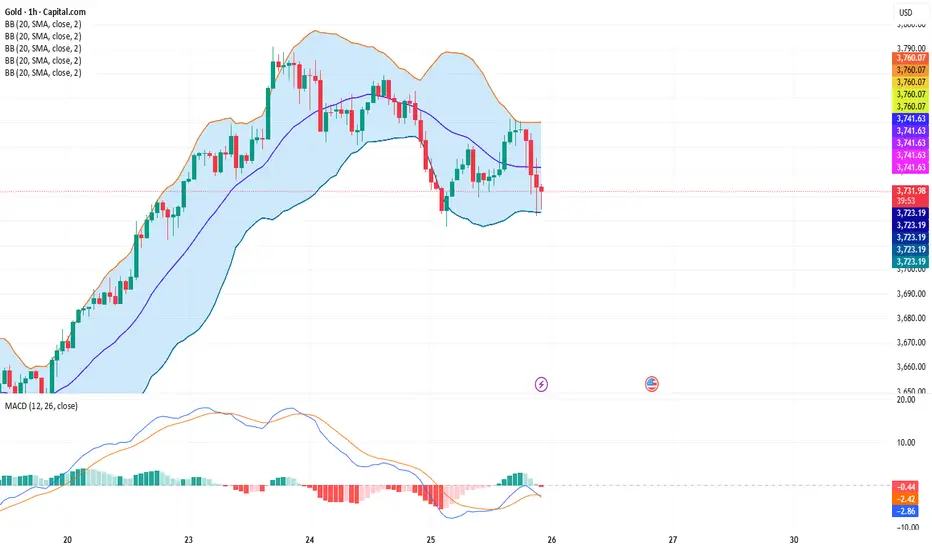
The current gold price has fallen back to around 3720, which is the second test of this support area. The previous low briefly dipped below 3720 before rebounding, with gains approaching tens of dollars.
From a technical perspective, this pullback is not a clear signal of a decline, but more likely a phased cleansing of bulls whose positions are not firm by the market, the so-called "washout" behavior. This type of correction helps solidify the upward momentum and creates conditions for a healthy breakout of gold prices to new highs.
Regarding trading strategies, all long positions held during the day have been taken profit. I currently prefer to invest in long positions on dips, with the intention of entering a long position between 3715 and 3725.
The above ideas are my personal opinions. The above ideas are personal opinions. If you have a better trading strategy, please leave a message in the comment area and let’s discuss and make progress together! Long 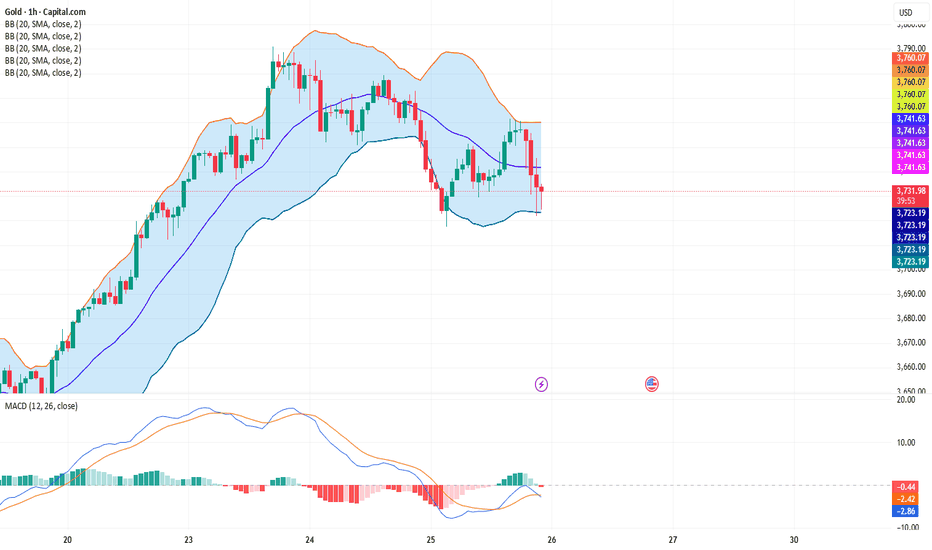
Long 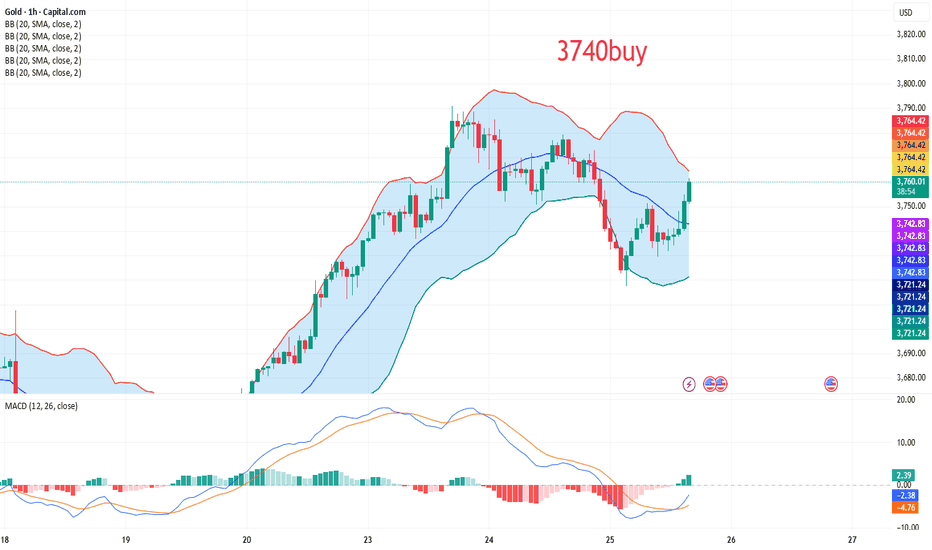
Don't rush into trading, you might be missing the most importantIn yesterday's analysis, I clearly stated that today's market trend was expected to be similar to last Wednesday's: that is, after reaching its high, gold prices would encounter resistance and fall back, entering a period of correction.
The actual market developments fully confirmed the accuracy of this prediction. Based on this expectation, we entered a short position at the opening price of 3765 and continued to increase our short position when it rebounded above 3775. We also seized a short-term long opportunity during this period, achieving significant returns overall. For detailed operational details, please refer to the analysis reports I published on Wednesday:
Returning to the current market, I will briefly analyze today's trading strategy.
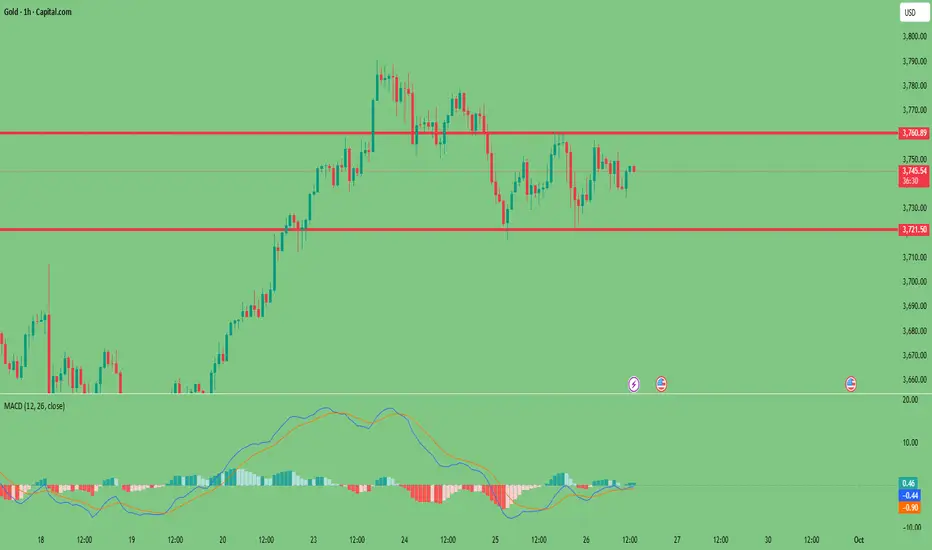
Based on the candlestick chart, the trend structure of the first three trading days of this week is highly similar to that of the same period last week, indicating that the market is still in a range-bound pattern. We expect the consolidation trend to continue today, with trading opportunities in both long and short directions. In the short term, we need to focus on the performance of the key support/resistance level of 3740. At present, I tend to wait and see, and then intervene when a clear signal appears during the trading session. Short 
Long Chocolate📌 Cocoa Futures: Seasonality, Trading Strategies & Market Drivers
Cocoa is more than just the foundation of chocolate; it’s a soft commodity with centuries of economic significance. Once used as currency by ancient civilizations in Central and South America, cocoa became a global commodity after the Spanish conquest introduced it to Europe. Today, it underpins a multibillion-dollar industry that spans confectionery, beverages, cosmetics, and pharmaceuticals.
Cocoa futures, traded on the ICE (Intercontinental Exchange), give traders and institutions exposure to this volatile market. These contracts are a critical tool for producers, exporters, chocolate manufacturers, and speculative traders. Because cocoa is grown almost exclusively in tropical regions—with over 70% of global supply coming from West Africa—it is highly vulnerable to weather, political instability, and labor disruptions, making it one of the most volatile agricultural commodities.
For traders, this volatility is both a challenge and an opportunity. With the right combination of technical setups, seasonal awareness, and macro fundamentals, cocoa futures can be a powerful addition to a diversified trading strategy.
🔹 1. A Simple but Effective Cocoa Futures Strategy (RSI + EMA Model)
One robust short-term trading framework for cocoa is built on two components: momentum (measured by the Relative Strength Index) and trend direction (measured by the 100-day Exponential Moving Average).
📌 Trading Rules:
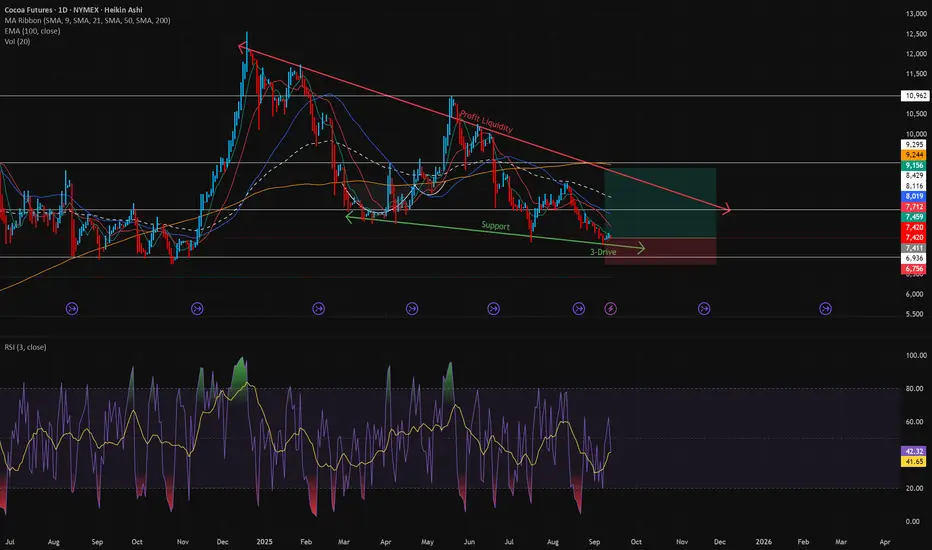
Buy Signal (enter next day open): When the 3-day RSI falls below 20 (oversold) and the close remains above the 100-day EMA.
Short Signal (enter next day open): When the 3-day RSI rises above 80 (overbought) and the close is below the 100-day EMA.
Risk/Reward (RR): Set at 2:1 for favorable risk exposure. I use Heikin-Ashi.
Historical Win Rate: Approximately 70%, meaning the system has shown consistent profitability in backtests.
📌 Why it works:
The RSI ensures entries are taken when the market is temporarily stretched.
The EMA filter avoids fighting against the broader trend, reducing false signals.
Cocoa, being highly mean-reverting, often corrects after extreme RSI conditions, especially when aligned with the prevailing long-term trend.
This makes the system simple enough for beginners yet effective for experienced futures traders looking for structured rules.
🔹 2. Seasonality in Cocoa Futures
In commodity trading, seasonality refers to recurring price tendencies tied to the calendar—harvests, weather cycles, or consumption trends. Cocoa has one of the clearest seasonal footprints in the soft commodity sector.
📈 Summer Months (June – September): Historically the strongest period for cocoa. Demand from chocolate manufacturers builds as companies secure supply ahead of year-end holidays. Weather risk in West Africa also coincides with the rainy season, which can create uncertainty about crop quality and yields.
📉 Winter Months (December – February): Often weaker as fresh harvest supplies enter the market. Prices may dip unless weather shocks disrupt output.
📌 Historical Example:
Between June and September 2020, cocoa futures rallied over 20% due to concerns about rainfall and labor issues in the Ivory Coast, even though global demand was still recovering from pandemic restrictions.
Thus, traders often rotate into cocoa longs during the summer months, much like how they rotate into corn or soybean trades during North American planting/harvest cycles.
🔹 3. Key Drivers of Cocoa Prices
Cocoa is especially sensitive to supply shocks because of its geographic concentration. A few core variables explain most of the large price swings:
1️⃣ Weather Conditions
Cocoa pods are delicate and require the right mix of rainfall and sunshine.
Too much rain → fungal outbreaks like Black Pod disease.
Too little rain → drought stress, smaller pods, and lower yields.
West Africa’s climate variability is the single largest driver of year-to-year volatility.
2️⃣ Labor Issues
Ivory Coast and Ghana rely heavily on manual labor for cocoa harvesting.
Strikes, disputes over wages, or child labor controversies can quickly cut output.
Supply disruptions ripple globally since these two countries account for over two-thirds of global cocoa exports.
3️⃣ Political Risk
Elections, coups, or civil unrest in cocoa-producing regions can paralyze exports.
Example: The 2010 Ivory Coast political crisis disrupted shipping, pushing cocoa futures to multi-decade highs.
4️⃣ Crop Diseases
Cocoa plants are vulnerable to pests and diseases.
The 2010 Black Pod outbreak alone wiped out 500,000 tonnes of cocoa.
The Cocoa Swollen Shoot Virus (CSSV) continues to be a structural threat.
5️⃣ Demand Shifts & Health Reports
Rising consumer demand for dark chocolate and functional foods (antioxidant-rich products) supports consumption growth.
Positive health studies on cocoa’s cardiovascular benefits can boost demand.
Conversely, economic downturns often weigh on chocolate consumption as it is seen as a semi-luxury item.
🔹 4. Seasonal Cocoa Trading Calendar
Month Key Events Typical Price Behavior Trade Implication
Jan–Feb Main crop exports Bearish pressure Avoid longs, look for shorts
Mar–Apr Mid-crop harvest Neutral to weak Cautious positioning
May–Jun Pre-summer build-up Bullish setup Early long entries
Jul–Sep Summer strength, weather risk Strongest seasonal rally Long futures, ETNs
Oct–Nov Rainy season risk Volatile Weather-driven trading
Dec Fresh harvest supply Often weak Take profits, rotate out
📌 Historical note: Cocoa’s June–September rally has persisted across multiple decades, making it one of the most reliable seasonal plays in the soft commodity space.
🔹 5. Vehicles for Trading Cocoa
Traders and investors can access cocoa in several ways:
Cocoa Futures (ICE: CC): Standardized contracts, physically delivered, high liquidity.
ETNs/ETFs:
NIB – iPath Bloomberg Cocoa Subindex ETN → easy exposure without futures account.
Chocolate & Confectionery Stocks:
Hershey (HSY), Mondelez (MDLZ), Nestlé (NESN.SW), Cheesecake (CAKE) → indirect exposure to cocoa demand.
Diversified Agricultural Funds: ETFs that include cocoa alongside coffee, sugar, and cotton.
📌 Conclusion: Best Cocoa Trading Strategy
Cocoa’s unique combination of ancient cultural roots, geographic concentration, and modern global demand makes it one of the most fascinating soft commodities to trade.
✅ Technical Edge: The RSI/EMA strategy offers a clear, rules-based approach with ~70% win rate.
✅ Seasonal Edge: Cocoa futures are strongest during summer (June–Sept).
✅ Macro Edge: Watch West African weather, labor strikes, and politics—they are the biggest price movers.
✅ Diversification Edge: Cocoa behaves differently than equities, metals, or energy, making it valuable for portfolio diversification.
While cocoa may not get the same attention as gold or crude oil, it remains a highly profitable niche market for traders who understand its seasonal flows and unique risks.  Long
Long
 Long
Long
 Long
Long
#Bitcoin Sunday Analysis: $BTC is holding near $118,330 #Bitcoin Sunday Analysis:
CRYPTOCAP:BTC is holding near $118,330 after last week’s bounce from $112,398, maintaining strong bullish momentum. Macro developments — including Trump’s $12.5T pension fund order allowing BTC inclusion, pro-crypto Fed nomination, and anti-debanking executive order — mark historic steps toward full BTC integration into the U.S. financial system.
🔸 Key Support Zone at $112,000–$113,000:
Liquidity pools remain here; market makers may dip price into this zone before resuming upside. This area offers a high-probability long entry.
🔸 Upside Target: $120,000 (Short-Term)
A breakout above range resistance could open the path to $125,000–$130,000 mid-term, fueled by whale accumulation, strong ETF inflows, and returning retail interest.
🔸 Risk Level at $110,000:
A sustained loss below this zone could slow bullish momentum, but macro and on-chain data suggest dips are buying opportunities.
🔸 Outlook:
Watch $112K–$113K for entries. Stay bullish above $110K. Prepare for possible volatility with CPI data Tuesday and PPI Thursday as potential breakout catalysts.  Long
Long
10 Types of Cryptocurrencies: Explanations and ExamplesCryptocurrencies go far beyond Bitcoin. Today’s digital asset market includes a wide variety of coins and tokens, each serving distinct purposes. Below are 10 key categories of cryptocurrencies with brief explanations and examples:
Store of Value Cryptocurrencies:
Used as a digital form of gold or a long-term value reserve.
▶ Example: Bitcoin (BTC)
Smart Contract Platforms:
Support decentralized applications and programmable transactions.
▶ Example: Ethereum (ETH)
Stablecoins:
Pegged to fiat currencies to reduce volatility.
▶ Examples: USDT, USDC
Payment Tokens:
Designed for fast, low-cost money transfers.
▶ Examples: XRP, Stellar (XLM)
Governance Tokens:
Allow holders to vote on protocol decisions.
▶ Examples: UNI, MKR
Meme Coins:
Inspired by internet culture and social trends.
▶ Examples: Dogecoin (DOGE), Shiba Inu (SHIB)
Gaming Tokens:
Used in blockchain-based games and metaverses.
▶ Examples: AXS, SAND
Privacy Coins:
Focused on anonymous, untraceable transactions.
▶ Examples: Monero (XMR), Zcash (ZEC)
NFT Tokens:
Represent digital collectibles or assets on-chain.
▶ Examples: Bored Ape, CryptoPunks (ERC-721)
Infrastructure Tokens:
Power scalability, cross-chain solutions, or protocols.
▶ Examples: Polkadot (DOT), Cosmos (ATOM)
Understanding these categories helps investors and users navigate the complex crypto ecosystem more effectively. Short 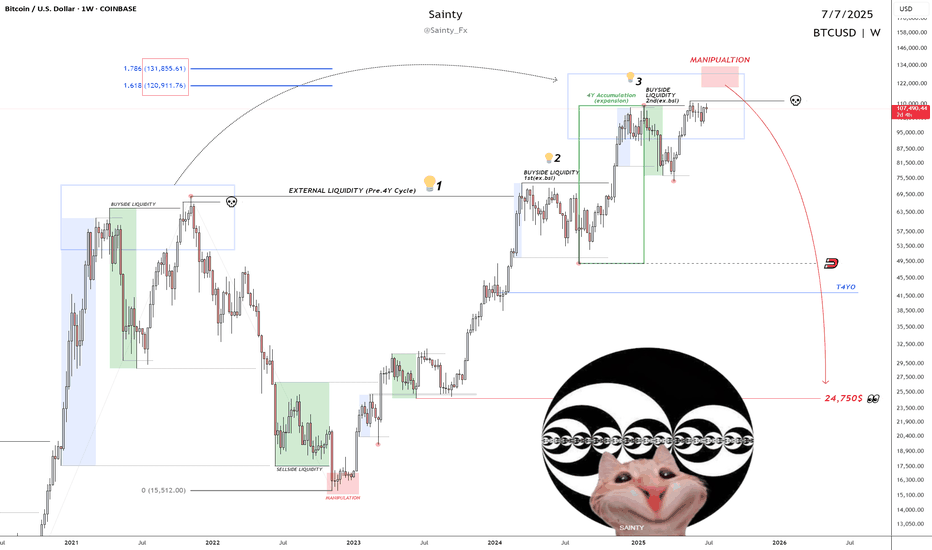
Short 
Long 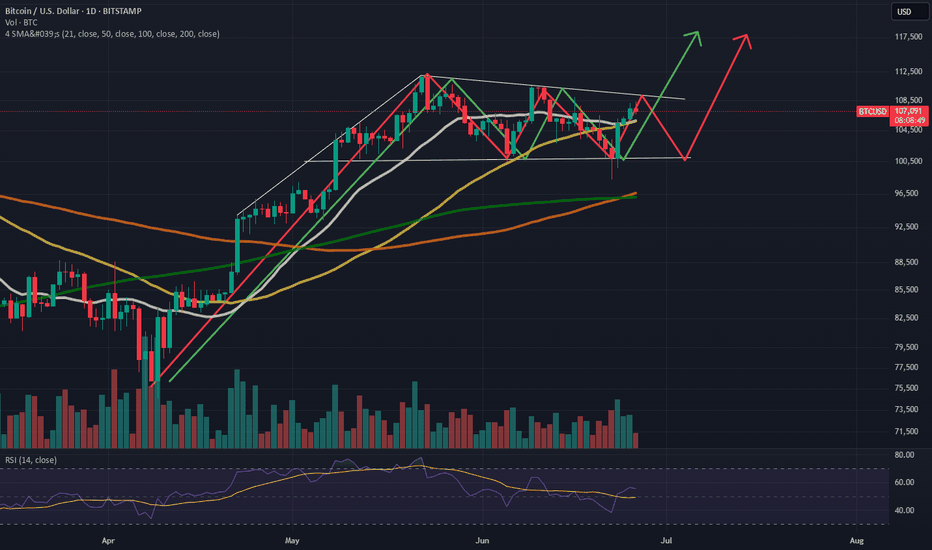
Long 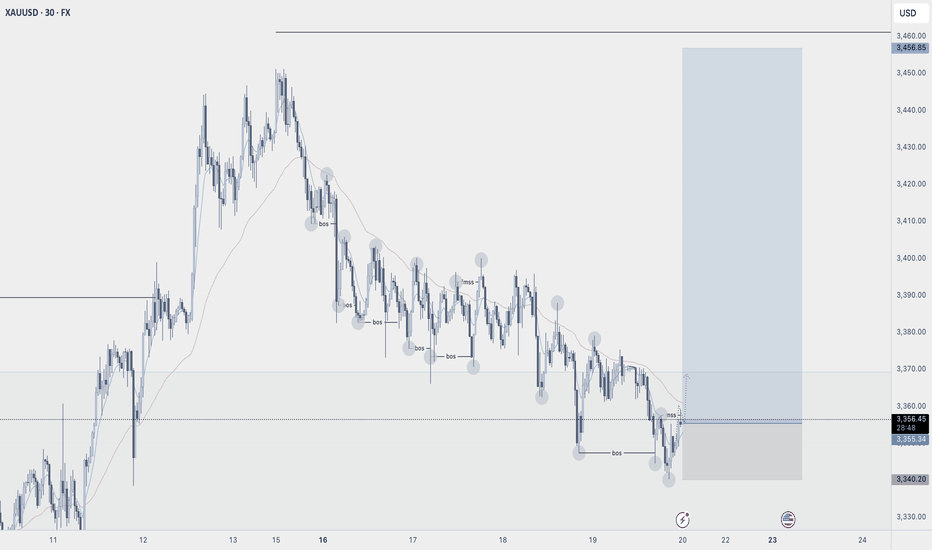
 Short
Short