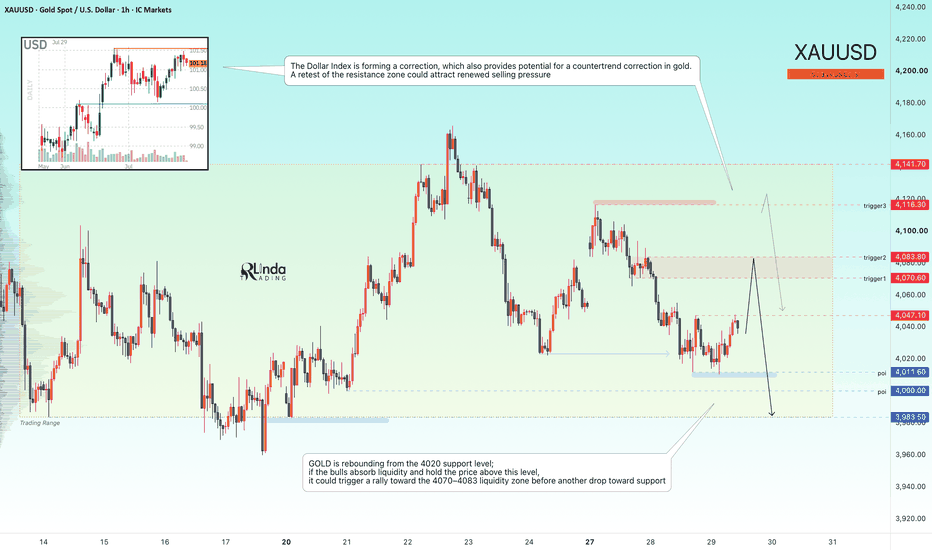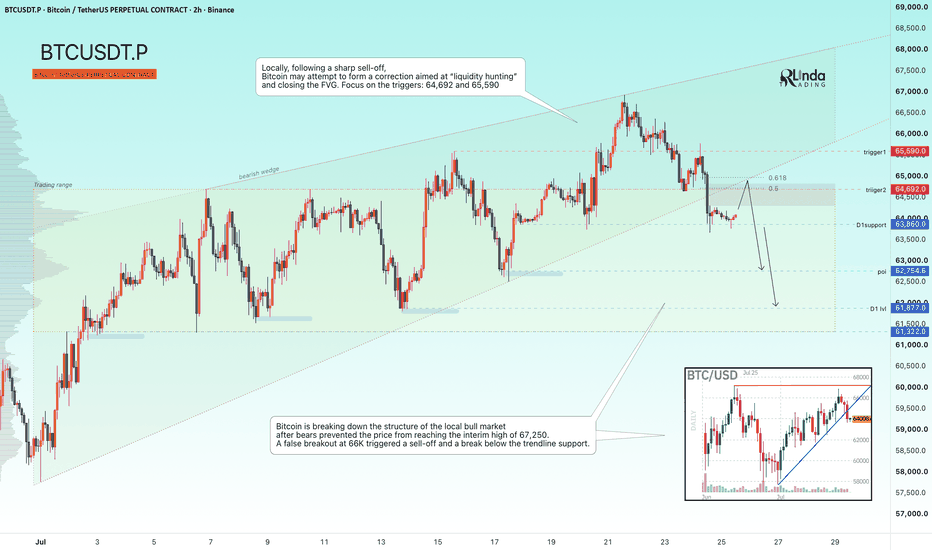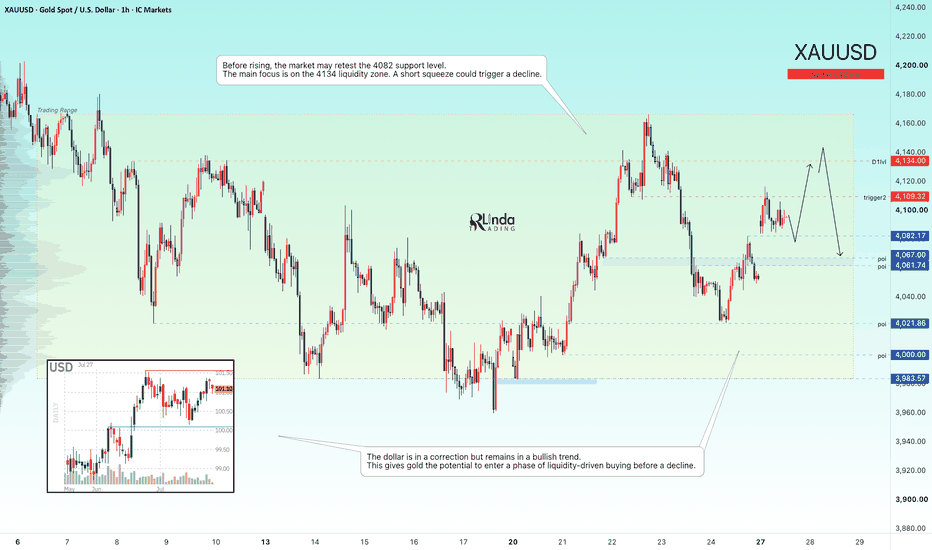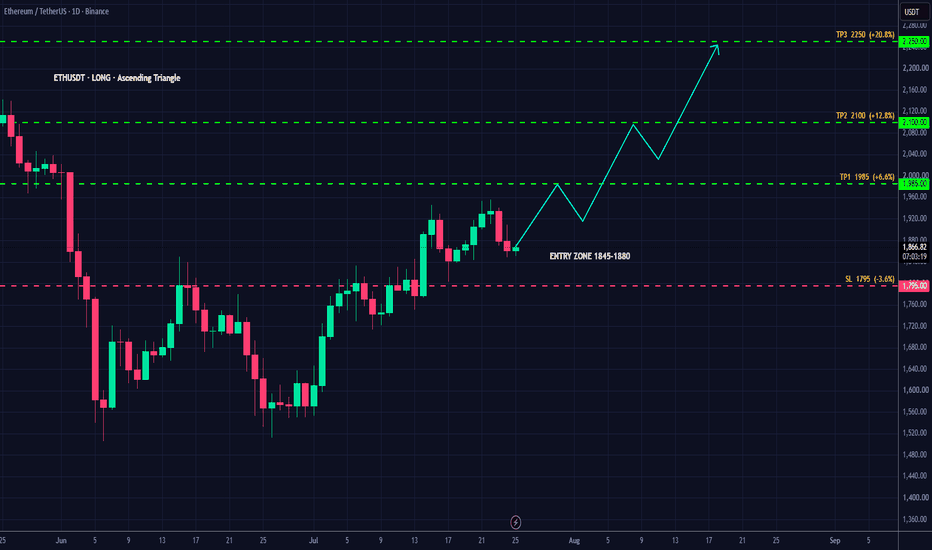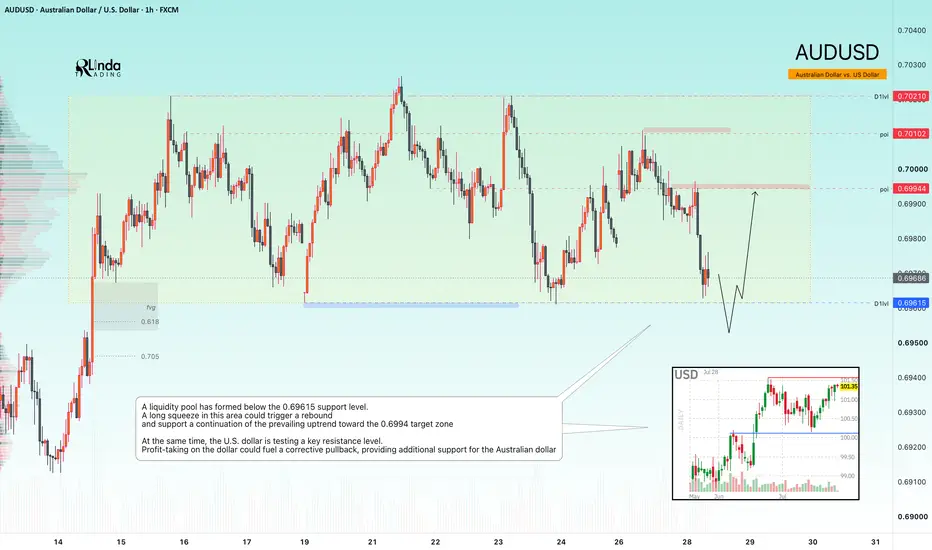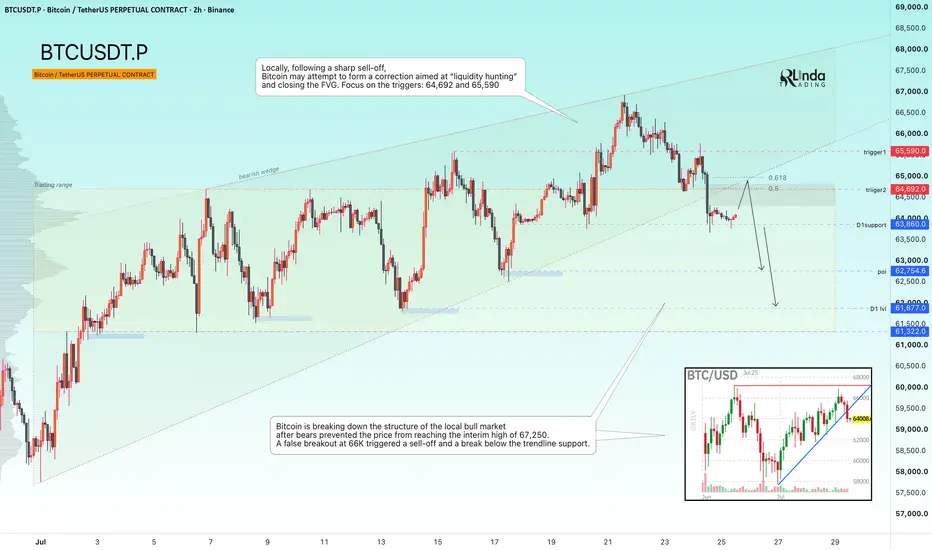
GOLD - Correction toward the resistance of the range ICMARKETS:XAUUSD continues to react to the geopolitical backdrop, while still remaining under pressure from both the global and local bearish trend. Meanwhile, the U.S. dollar remains in stagnation, forming a trigger around the 99.0 area
Optimism surrounding a potential peace deal has started to fade amid ongoing hostilities. The dollar remains range-bound, but at the same time continues to receive support from geopolitical tensions and hawkish rate expectations. Further movement in gold will largely depend on developments around the ceasefire narrative and oil market dynamics.
Key catalyst:
- Official confirmation by Trump of the proposed 60-day ceasefire with Iran (or a breakdown of negotiations).
Drivers:
- Bearish — Failed negotiations, escalation, hawkish Fed rhetoric, a stronger dollar, rising oil prices
- Bullish — Official ceasefire confirmation, de-escalation, dovish Fed signals, declining oil prices
Resistance levels: 4540, 4580, 4600
Support levels: 4488, 4465, 4450
Technically, gold has returned back into the trading range. A retest of the 4540 liquidity zone could trigger a corrective move toward support (a manipulative move) before a potential continuation higher toward the upper boundary of the range.
Best regards, R. Linda
Triangle
GBPUSD - The trade we were waiting forGBPUSD is in the final E leg of its triangle pattern correction. Once this pattern is complete we will see GBPUSD making its next impulse which will easily take it back above 1.42500 levels
If traded correctly this can provide traders with a huge RR opportunity. Trading the price movement at the completion of wave E will give traders a fantastic RR of over 8+ keeping the low of wave C as their fixed stop loss
Safer traders may choose to wait till the price breaks out of the wedge, confirming the completion of the pattern and keep the low of wave E as a SL. This would give them an average RR of about 1:3 depending on how and where wave E has ended.
Triangle patterns can get confusing and are designed to frustrate and throw traders off. Although, if these patterns are identified in advance the reward they offer can be huge
EURUSD Descending Channel Keeps Pressure on Price ActionHello traders! Here’s my technical outlook based on the current EURUSD (4H) chart structure. EURUSD previously traded inside a descending channel after rejecting from the major resistance trendline. Following a strong bearish move from the pivot high, price continued respecting the channel structure and formed multiple breakdowns below key support levels. Currently, EURUSD is trading below the 1.1660 seller zone while approaching the 1.1560 buyer zone, which acts as the key support area. Price recently consolidated inside a short-term range near resistance and failed to break above the descending resistance line. As long as EURUSD remains below the 1.1660 resistance zone and continues to respect the descending channel resistance, the bearish scenario remains valid. A continuation lower could push price toward the 1.1560 buyer zone (TP1). Please share this idea with your friends and click “Boost” 🚀
Sterling lags peers as Markets Reassess U.K. Outlook GBP/USD found its footing midway through Thursday, May 28 but remained down around -0.15% on the week as Sterling continues to struggle for momentum amid growing concern about the U.K. economic outlook. Recent U.K. data has pointed toward slower activity across consumer-facing sectors while elevated borrowing costs and persistent inflation continue tightening financial conditions. Investors remain cautious toward U.K. assets following recent volatility in Gilt markets, with concerns lingering that weaker growth and sticky inflation leave policymakers with limited flexibility.
In the United States, a comparatively firmer economic backdrop and stable Treasury yields helped keep the U.S. Dollar supported, though risk‑on sentiment following Thursday’s Iran‑related headlines erased much of its early‑week strength. Markets continue to view the Federal Reserve as patient but not yet prepared to pivot aggressively, particularly as inflation risks tied to energy and supply chains remain present underneath the surface. For Sterling, the challenge remains balancing slowing domestic momentum against a U.S. Dollar still benefiting from relative macro resilience, leaving GBP/USD stuck in a subdued and range-bound environment to close the week.
In the above chart, GBP/USD rates consolidated into a symmetrical triangle since the start of the year: resistance is defined by the downtrend from the January and May 2026 highs, while support is defined by the uptrend from the January 2025 and March 2026 lows. Contextually, the consolidation marks a continuation of sideways, choppy price action that has keep GBP/USD rangebound between 1.3000 and 1.3800 since last April. In the short-term, the lack of direction leaves GBP/USD in a relatively unappealing setup; in the long-term, the consolidation (akin to a coiling spring) will ultimately lead to a breakout. Traders should be open-minded about either a move higher or lower, though patience may be required.
RBCAA: Weekly Ascending Triangle Breakout1. The Macro Perspective: The Multi-Year Consolidation Base
I am taking a LONG bias on Republic Bancorp, Inc. (RBCAA) on the macro weekly (1W) timeframe.
When analyzing pure market structure on a financial institution, prolonged consolidation periods are necessary to build the kinetic energy required for secular markups. Looking at the chart, following its previous run, RBCAA entered a massive, multi-year ascending triangle pattern. This structure was firmly capped by a formidable overhead resistance ceiling while buyers systematically raised their bids along a clear diagonal support trendline. This sideways-to-upward digestion effectively absorbed floating supply and allowed institutional buyers to quietly accumulate shares. Fundamentally, this technical momentum aligns perfectly with Republic Bancorp's recent robust financial performance. The company reported Q1 2026 earnings per share (EPS) of $2.18, which beat analysts' expectations of $1.86 by 17.20%. Additionally, Q1 2026 net income reached $42.6 million, driven by Core Bank net interest income expanding to $63.2 million, up 12%. Furthermore, the company has maintained dividend payments for 29 consecutive years and currently offers a 2.73% dividend yield, making it highly attractive to long-term institutional capital.
2. The Educational Setup: Horizontal Resistance and Ascending Support
To understand the technical validity behind this macro launch, look closely at how the price structure interacted with its core boundaries right before breaking out:
The 75.91 Resistance Ceiling: The definitive line in the sand for a bullish continuation was the solid black horizontal resistance line drawn at 75.91. As the price tested this line repeatedly over the past two years, it established a clear, heavy supply zone that systematically rejected upward expansion.
The Ascending Trendline: During the consolidation block, notice how every significant pullback was heavily defended at progressively higher levels, forming the solid black diagonal support line. Institutional buyers repeatedly stepped in, eventually allowing the rising weekly 20 SMA (the middle blue line of the Bollinger Bands) to catch up and act as a dynamic launchpad. This squeezed volatility directly against the 75.91 resistance zone.
3. Current Price Action: Breakout and Volatility Expansion
Look at the most recent weekly candles on the far right of the chart. The structural pressure cooker has officially exploded. Institutional buyers have stepped in with undeniable conviction, printing a sequence of powerful green expansion candles that have vertically surged up to the 80.49 level. This explosive thrust has decisively obliterated the 75.91 multi-year ceiling on an expanding volume profile. The stock has officially transitioned out of low-volatility accumulation and into a highly explosive markup trend into blue-sky territory.
4. The Trade Plan: Entries, Targets, and Risk Management
Entry Strategy: Momentum is exceptionally strong with the stock trading firmly out in the open above the breakout line. Chasing a vertical breakout carries an inherent risk of a short-term, lower-timeframe mean-reversion pullback. The highest-probability, lowest-risk entry strategy involves stepping down to the daily timeframe and waiting for the initial vertical excitement to cool off. Look to scale into long positions or place limit orders to catch a potential pullback to perfectly retest the broken 74.00 to 76.00 prior resistance zone. Letting old historical resistance prove itself as a concrete new support floor provides an unmatched risk-to-reward ratio.
Take Profit (Targets): Because the stock is clearing a major multi-year structure to launch into pure price discovery, we use a measured move strategy based on the depth of the accumulation base. By taking the maximum depth of the ascending triangle at its widest point (roughly 27 points from the ~49.00 structural floor up to the 75.91 ceiling) and projecting it upward from the breakout point, our primary structural macro target sits comfortably in the 102.00 to 104.00 zone over the coming quarters.
Invalidation (Stop Loss): An explosive macro breakout thesis is completely invalidated if the price fails to hold its newly claimed structural floor and collapses back inside the core of the base boundaries. A hard stop loss should be placed safely below the recent weekly swing low and the diagonal trendline, specifically around the 68.00 to 70.00 level. A definitive weekly close completely back below 68.00 would act as a severe warning sign of a failed macro breakout and a major bull trap.
5. Time Horizon:
Because this technical setup is built on a 1-Week chart capturing a massive structural phase transition and an all-time high horizontal breakout, this is a longer-term position trade designed to capture a secular markup phase over the coming months and quarters. Let the macro trend run!
EURUSD: Forms Bullish Triangle After Channel BreakoutHello everyone, here is my breakdown of the current EURUSD setup.
Market Analysis
EURUSD previously traded inside a wide range before forming several fake breakouts near both the upper and lower boundaries. After failing to maintain bearish momentum below support, price reversed and entered a short-term recovery phase.
Currently, EURUSD is trading above the 1.1620 support zone while remaining below the 1.1670 resistance zone, which continues to act as the key supply area. Price also broke above the descending channel structure and is now respecting the ascending triangle support line, signaling that buyers are gradually regaining control.
My Scenario & Strategy
As long as EURUSD remains above the 1.1620 support zone and continues to respect the ascending triangle support line, the bullish scenario remains valid. A continuation higher could push price toward the 1.1670 resistance zone (TP1).
However, if price breaks back below the 1.1620 support zone and loses the triangle structure, bullish momentum could weaken, opening the path for another bearish move.
That’s the setup I’m tracking. Thank you for your attention, and always manage your risk.
EURUSD Faces Strong Resistance - Bears Target 1.1590 SupportHello traders! Here’s my technical outlook based on the current EURUSD (3H) chart structure. EURUSD previously traded inside a descending channel after rejecting from the major trendline resistance. Following a breakout below the previous range support, price continued to respect the bearish structure and entered consolidation near the buyer zone. Currently, EURUSD is trading above the 1.1590 buyer zone while remaining below the 1.1660 seller zone, which continues to act as the main resistance area. Price recently bounced from the ascending support line but still trades below the descending trendline, signaling that sellers remain active. As long as EURUSD remains below the 1.1660 resistance level and respects the descending resistance trendline, the bearish scenario remains valid. A rejection from the current resistance area could push price toward the 1.1590 buyer zone (TP1). Please share this idea with your friends and click "Boost" 🚀
Tesla Daily: Severe Macro Compression Encounters Major 452 ResisTesla, Inc. ( NASDAQ:TSLA ) is trading inside an incredibly clean and high-stakes technical environment on the Daily Chart, characterising a classic macro price compression structure.
As volatility tightens near the apex of this major multi-month pattern, institutional order flow is fast approaching a significant decision point.
### Key Technical Factors:
* **The Macro Symmetrical Compression:** The stock is tightly trapped between a long-term descending trendline (LTB) capping the upside and a steep, aggressive ascending trendline (LTA) supporting the recent aggressive recovery from April lows.
* **The 452.87 Horizontal Resistance Wall:** The red line at 452.87 represents a severe structural supply zone. As the price attempts to break out of the triangle, it faces immediate overhead defense from institutional sellers at this precise level.
* **The EMA 200 Support Baseline:** The 200-Period Exponential Moving Average (purple line currently near 394.74) acts as the fundamental long-term value baseline. The price remains heavily extended from this core support area.
### Strategic Scenario (The Multi-Step Sequence):
The green arrows plotted on the chart capture the high-probability strategic path as liquidity compresses:
1. **Short-Term Rejection & Retest (First Waves):** Given the confluence of the LTB and the 452.87 horizontal resistance, an immediate clean breakout is unlikely. We anticipate a localized pullback to test the dynamic support of the rising LTA.
2. **The Apex Decision:** After a brief ping-pong rotation near the apex, if buyers fail to print a sustained daily close above the 452.87 barrier, exhaustion will likely trigger a major mean-reversion move.
3. **The Macro Target (394.74 - 400.00):** A failure at the top boundary opens the path for a steep corrective drive down toward the **EMA 200 baseline near 394.74**, offering a premium structural support test for long-term buyers.
### Execution Plan:
Patience is paramount within this squeeze zone. Chasing momentum right into a structural double-resistance (LTB + Horizontal Wall) offers an unfavorable risk-reward profile. We closely monitor lower timeframe confirmations near the boundaries before validating any major swing positioning.
---
📊 **ProData Chart** | By Rogerio Zaglia
*12+ years of daily global market technical analysis.*
⚠️ **Disclaimer:** This analysis is for educational and informational purposes only. It does not constitute financial advice or an investment recommendation. Past performance is not indicative of future results.
NZDUSD - A false breakout of resistance amid a bearish trendFX:NZDUSD is forming a manipulation setup around the trading range resistance amid the ongoing local downtrend...
NZDUSD remains trapped in a difficult position: the RBNZ is being forced to tighten policy against a weakening economy due to external shocks. The market has already priced in two more rate hikes before year-end, providing downside support around the 0.5800 area. Positioning data from major market participants continues to reflect a consolidated bearish bias on NZD. This underlying structure has not changed even after the RBNZ’s hawkish signal — medium-term players still do not believe in the sustainability of NZD strength amid deteriorating economic conditions.
From a technical perspective, a false breakout is developing around the D1–W1 resistance zone...
Resistance levels: 0.5890, 0.5912
Support levels: 0.5865, 0.5835, 0.5825
Locally, the market is bouncing from 0.5865 amid a rebound in the DXY index, but the broader structure remains intact. The pair is currently testing an imbalance zone, and a local short squeeze could trigger a decline toward the lower boundary of the range, with potential continuation toward medium-term lows.
Best regards, R. Linda
BITCOIN - The hunt for liquidity ahead of the fall BINANCE:BTCUSDT is forming a downtrend both globally and locally. The focus is on the key support and resistance levels of 75,300–78,100; within the intraday price action, following a sharp decline, the price has entered a phase of liquidity hunting.
Large companies continue to transfer bitcoins to exchanges; U.S. spot bitcoin ETFs have seen outflows for the sixth consecutive day; asset managers and dealers are in a net long position, but leveraged speculators are holding a significant short position, which is creating pressure.
On May 14, the CLARITY bill passed the Senate Banking Committee by a vote of 15–9 and is awaiting a full vote. The market has already reacted to rumors, and going forward, it may already price in the news. At this point, it is worth focusing on the technical context—a downtrend, short squeezes, and new lows.
Resistance levels: 76,000, 76,650, 78,100
Support levels: 75,300, 74,200, 73,700
A correction is forming, during which the market may test areas of interest and liquidity before falling. Focus on 76K – 76,600 and 77,800. A short squeeze could trigger a sell-off. Consolidation below 76K – 75,300 will intensify pressure from the bears.
Best regards, R. Linda!
GOLD - Flat, pressure from bearsICMARKETS:XAUUSD is giving up all of Monday’s gains and may test the 4,500 level again. The immediate direction will be determined by developments surrounding the negotiations and the fragile ceasefire, as well as oil price movements. As long as risk aversion and the dollar remain dominant, gold will stay under pressure
The positive sentiment surrounding the ceasefire that emerged over the weekend quickly turned negative. The dollar is currently stagnating but is consolidating above key support, which is putting pressure on gold. The resumption of oil price growth is fueling inflation fears, bringing “hawkish” expectations regarding the Fed rate back to the forefront. The market estimates the probability of a rate hike by the end of the year at just over 50%
Drivers:
Downside: Escalation, breakdown of negotiations, rising oil and dollar, hawkish signals from the Fed.
Upside: Progress in negotiations, de-escalation, falling oil, weakening dollar
Resistance levels: 4540, 4580, 4589
Support levels: 4500, 4488, 4465
Technically, consolidation below 4540 could lead to a decline to 4488 (liquidity zone). However, a primary retest of support and a long squeeze could trigger a minor pullback to 4540 before the decline continues to 4450–4420
Best Regards, R. Linda!
BTCUSDT: Price Reaction at Key Support Could Trigger Upside MoveHello everyone, here is my breakdown of the current BTCUSDT setup.
Market Analysis
BTCUSDT previously traded inside an upward channel, confirming strong bullish momentum. After reaching the triangle resistance line, price formed a fake breakout near the upper boundary. Following the rejection, BTC entered a corrective move and started consolidating near the lower support structure.
Currently, BTCUSDT is trading above the 76,000 support zone while remaining below the 78,100 resistance zone. Price recently formed another fake breakout below support, but buyers quickly pushed the market back above the triangle support line, signaling that bullish pressure is still active despite recent volatility.
My Scenario & Strategy
As long as BTCUSDT remains above the 76,000 support zone and respects the triangle support line, the bullish scenario remains valid. A rebound from the current area could push price toward the 78,100 resistance zone (TP1).
However, if price breaks below the 76,000 support zone and loses the triangle structure, bullish momentum would weaken, opening the path for a deeper correction.
That’s the setup I’m tracking. Thank you for your attention, and always manage your risk.
FTSE 100 Daily: Symmetrical Triangle Breakout Looming at Key LonThe UK 100 (FTSE 100 Index) is presenting a highly textbook technical structure on the Daily Chart, consolidating within a large Symmetrical Triangle pattern.
As a core benchmark for European markets, tracking these macro compressions provides excellent high-probability setups for position and swing traders.
### Key Technical Insights:
* **The Symmetrical Triangle Compression:** Following a powerful long-term bull run, the index has entered a healthy consolidation phase. The price has captured liquidity at the lower ascending trendline and is now actively testing the upper descending resistance line.
* **Key Overhead Resistance Levels:** A successful breakout faces immediate horizontal resistance at the **10,635 level** (previous structure high). Beyond that, the ultimate macro target sits at the major historical peak of **10,910**.
* **The EMA 200 Baseline:** The long-term trend remains firmly bullish, beautifully supported by the rising 200-Period Exponential Moving Average (purple line currently climbing near 9,936), keeping the structural buyer bias intact.
### Strategic Scenario (The Breakout Sequence):
The green arrows on the chart illustrate the expected technical behavior as liquidity dries up near the apex:
1. **Short-Term Rejection/Retest (First Arrow):** A minor, healthy intraday pullback from the upper trendline to retest internal local support within the triangle structure.
2. **The Bullish Expansion (Second Arrow):** A decisive daily close above the descending trendline, triggering momentum to attack the 10,635 resistance barrier and opening the doors for a macro continuation rally toward 10,910.
### Execution Takeaway:
Watch the daily close carefully. A confirmed breakout from this compression pattern will offer a highly favorable risk-to-reward ratio for long positions, using the triangle's lower support line for risk definition.
---
📊 **ProData Chart** | By Rogerio Zaglia
*12+ years of daily global market technical analysis.*
⚠️ **Disclaimer:** This analysis is for educational and informational purposes only. It does not constitute financial advice or an investment recommendation. Past performance is not indicative of future results.
AUD/USD — The Gap Will FillAUD/USD opened the week with a gap higher and has been unable to extend. Instead it's coiling into a descending triangle beneath a flat support shelf — a structure that typically resolves lower as sellers press lower highs into a level that eventually gives way.
With an unfilled gap sitting below and momentum rolling over, the path of least resistance is a continuation lower to close that gap.
📉 Bias: bearish continuation into the gap.
Key 1H levels
• Descending-triangle support: ~0.7170 (breakdown trigger)
• Unfilled gap zone: 0.7138–0.7148
• Downside target: 0.7144 (gap fill)
Execution: favours shorts on a confirmed break and hold below the triangle's flat base, targeting the gap; lower highs against that floor keep pressure down.
Invalidation: an hourly close back above ~0.7180 / the descending resistance negates the structure.
Clean confluence — a bearish continuation pattern stacked above an unfilled gap. Not financial advice. Does AUD/USD close the gap? 👇
1H timeframe
#AUDUSD
HYPE Just Broke Out _ But This Could Still Be a TrapOver the weekend, Hyperliquid ( BINANCEUS:HYPEUSDT HYPE) drew major attention across the crypto community and rallied by roughly +20%. The move was fueled by the USDC revenue shift narrative and the market’s focus on HYPE’s programmatic buyback dynamics tied to protocol revenues, alongside fresh media hype. In parallel, SpaceX-related perpetual contracts on a platform built on Hyperliquid infrastructure brought attention from outside the crypto bubble as well.
Now, let’s take a technical look at the HYPE token on the 4-hour chart.
The HYPE token recently hit new all-time highs thanks to recent news, and it seems to have broken through the resistance zone($62.00-$59.00). However, the volume on the breakout wasn’t particularly high, so there’s some concern that this could be a fake breakout.
The HYPE token is also near the Cumulative Short Liquidation Leverage($66.20-$64.80), a Potential Reversal Zone(PRZ) , and the psychological round number of $70. Over the past 10 days, it has been moving within an ascending channel.
From Elliott Wave Theory, it seems the HYPE token is finishing its main wave 5, so we might expect a corrective phase afterward.
I expect the HYPR token to start declining after entering the Cumulative Short Liquidation Leverage($66.20-$64.80) and from the top of the ascending channel and PRZ.
First Target: $60.10
Second Target: $57.93
Third Target: $55.20
Stop Loss(SL): $70.10(Worst)
What do you think about the HYPE token? Can it break past $70, or should we expect a corrective phase?
💡 Please respect each other's opinions and express agreement or disagreement politely.
📌Hyperliquid Analyze (HYPEUSDT), 4-hour time frame.
🛑 Always set a Stop Loss(SL) for every position you open.
✅ This is just my idea; I’d love to see your thoughts too!
🔥If you find it helpful, please BOOST this post and share it with your friends.
Silver Bulls Eye Breakout as H4 Coil TightensSilver finds itself pulling back towards a support zone comprising former resistance at $77 and the uptrend dating back to the lows struck on May 20 on the H4 timeframe, creating a potentially interesting entry point for longs considering the broader structure the price trades within resembles something akin to an ascending triangle and ascending channel cross.
The price tested the support zone earlier today and bounced strongly, so if we see a repeat performance with the current candle, longs could be set ahead of the uptrend with a tight stop beneath for protection, targeting a run back towards $78 where the price has repeatedly struggled over recent days. Should the setup play out as planned, traders could then assess whether to hold, reduce or reverse the position depending on the price action above $78.
Considering there’s little in the way of visible resistance above the double top at $78.90 struck on May 19, a break of that level, especially given the coiling structure silver finds itself trading within, could set the stage for a more pronounced bullish move towards $82 or $83 where the price did plenty of work either side of those levels earlier this month.
For now, the oscillators are broadly neutral in their messaging with RSI (14) holding above 50 while MACD has pushed marginally into positive territory. To be sure, the flattening in both indicators suggests the fleeting upside momentum that had been building has stalled for now, but the price action and broader structure continue to favour long setups at this stage.
Of course, should the price break the May 20 uptrend and hold beneath it, the bullish bias would be invalidated.
Good luck!
DS
Gold at a Decision Point: Breakdown Towards 4,000$?Gold is moving into one of the most important technical zones on the chart.
After the strong rally earlier in the year, XAUUSD has been forming a sequence of lower highs under a clear descending trendline. Every attempt to recover has been capped before buyers could regain full control, which suggests that momentum is no longer as clean as it was during the previous upside phase.
The key area now is the support zone around $4,300–$4,380, which also overlaps with the 200-day SMA. This makes the zone important for both short-term traders and larger trend-following participants. As long as price remains above this area, gold still has a chance to stabilize and attempt another bounce toward the descending resistance.
However, the setup becomes much more dangerous if this support fails.
A decisive daily close below the $4,300 area would signal that buyers are losing control of the structure. In that case, the next logical downside magnet could be the psychological $4,000 level, especially if the breakdown is confirmed with follow-through selling and weak reaction from the 200-day moving average.
For the bearish scenario to remain valid, gold needs to stay below the descending trendline. A strong breakout above that trendline would change the picture and suggest that sellers are losing pressure. Until that happens, the chart still looks vulnerable to another rejection.
What I’m watching:
Resistance: descending red trendline
Key support: $4,300–$4,380 zone
Trend filter: 200-day SMA
Bearish confirmation: daily close below support
Possible downside target: $4,000
Invalidation: clean breakout above the descending trendline
This is not about predicting the next candle. It is about identifying the zone where the risk/reward becomes interesting. Gold is compressed between trendline resistance and major moving-average support — and the next break could define the next major directional move.
Red triangleAn interesting chart structure with two possible outcomes yet to be determined.
The price is moving within the red triangle and is currently near the upper boundary.
A bullish view suggests a potential breakout followed by the completion of a double bottom pattern, with the neckline at €1,750.
Conversely, in a bearish scenario, the price has just been rejected by the weekly SMA10 near the upper edge, with a probable return toward the bottom of the triangle, where a bearish breakout could follow.
I’ve noticed that many stocks in the luxury sector are currently sitting just below major resistance levels awaiting a breakout... what is about to happen?
This is just food for thought, as I believe the best move is to place some alert, wait and see which side of the triangle breaks first.
Keep a close eye on the volumes!
EURUSD - Consolidation above key resistanceFX:EURUSD opened the week with a bullish gap amid hopes for a U.S.-Iran peace deal, erasing the previous week’s decline to a low of 1.1575
The euro is caught in a stagflation trap: weak PMIs and the risk of recession are causing the market to doubt the ECB’s ability to tighten policy, despite inflation above 3%. Technically, the focus is on the 1.16357–1.1660 range. Continued optimism regarding the situation in the Middle East could support further gains (the market may strengthen from 1.1635 toward 1.168–1.1722)
Resistance levels: 1.1635, 1.168, 1.1722
Support levels: 1.1627, 1.1583
Technically, there are attempts to break the local structure; the reason is a gradual shift in the geopolitical backdrop and a weakening dollar, which presents opportunities for the euro.
If the bulls keep the price above 1.1635, this could become a technical driver for growth
Best Regards, R. Linda!
XAUUSD Short: Pressure Below Key Supply Zone - 4,470 Next TargetHello traders! Here’s my technical outlook based on the current XAUUSD (2H) chart structure. XAUUSD previously traded inside a descending channel before forming a major pivot point near the 4,470 demand zone. After that reversal, price entered an ascending channel and attempted to recover bullish momentum.
Currently, XAUUSD is trading below the 4,560 supply zone while forming a lower high structure under the descending supply line. Recent breakout attempts near resistance failed to hold, confirming that sellers remain active.
As long as XAUUSD remains below the 4,560 resistance zone and continues to respect the descending supply line, the bearish scenario remains valid. A continuation lower could push price toward the 4,470 demand zone (TP1). Manage your risk!
GOLD - The geopolitical backdrop is changing ICMARKETS:XAUUSD closed Friday’s session near 4,500 and looks fairly weak, with a bearish bias. However, the geopolitical backdrop is shifting over the weekend, which could trigger a gap or a locally positive tone in the market
Following a phone call between Middle Eastern countries and the U.S., Trump stated: “The agreement is largely agreed upon and awaits final approval between the United States of America, the Islamic Republic of Iran, and various other countries.”
On May 22, the new Fed Chair Kevin Warsh was officially sworn in, promising a “reformist” approach but emphasizing independence from the White House. Key catalysts for the coming week: U.S. GDP data (Q1), core PCE (the Fed’s inflation indicator, May 28), as well as developments in the Iran negotiations.
Resistance levels: 4540, 4589, 4646
Support levels: 4500, 4488, 4465
Technically, the market may react quite positively to the shift in the geopolitical backdrop. Bulls may hold the 4500 area, and at the session open, the price may open with an upward gap or continue its movement sharply; a breakout of the local trend line could strengthen the momentum.
There is a possibility of growth to 4589 - 4646 - 4734
Best regards, R. Linda!
BTCUSDT Triangle Breakdown Setup - Bears Eye 76,300 SupportHello traders! Here’s my technical outlook based on the current BTCUSDT (1H) chart structure. BTCUSDT previously traded inside a descending channel, confirming bearish market pressure. Currently, BTCUSDT is trading below the 77,800 seller zone while holding above the 76,300 buyer zone, which acts as the key support area. Price recently formed a tightening triangle structure and failed to break above the descending resistance line, signaling that sellers remain active and bearish momentum is still dominating the market. As long as BTCUSDT remains below the 77,800 resistance zone and continues to respect the descending resistance structure, the bearish scenario remains valid. A continuation lower could push price toward the 76,300 support zone (TP1). Please share this idea with your friends and click "Boost" 🚀
EJ Forms "Symmetry" but Signals A Breakout Soon This year, OANDA:EURJPY has found itself quite Consolidated between a 181 and 187 price range, while currently trading around 184.
Within the past couple weeks, we can see an even tighter Consolidation happening in the form of what is called a Symmetrical Triangle!
Now a Symmetrical Triangle forms when a balance is found between the Buyers (Bulls) and Sellers (Bears) with a Falling Resistance and a Rising Support into a fairly tight Price Point where typically we see price make an extreme Breakout of either the Resistance or Support leg of the Pattern, verifying either the Bulls or Bears have won out.
Now respectfully, either scenario is possible so it is important to wait for a Valid Breakout and Successful Retest with added Confirmation.
- Indicators like Volume, RSI and the MACD all show tells that this pair is truly in a Consolidation Phase and with a Breakout, will exhibit strong fluctuations in data strengthening the Bullish or Bearish Breakout!
Fundamentally, we seen a great deal of Bullish outcomes in the month of May for the JPY like:
- M2 Money Stock y/y posting a .3% increase from 2% to 2.3% meaning more money is circulating in the Japanese economy meaning consumers and businesses have greater access to finances.
- PPI y/y increasing 2% from 2.9% to 4.9% meaning the expectations of Interest Rate hikes could rise given the Producers Price Index is typically found as a good warning tool for early Inflation.
Also lets not forget the serious Intervention we witnessed with the JPY talked about by Japan Finance Minister to help "prop up" and stabilize the falling Japanese Yen!
This week EUR and JPY will have market moving news events so stay vigilant!