SwiftEdge EQH/EQL Liquidity
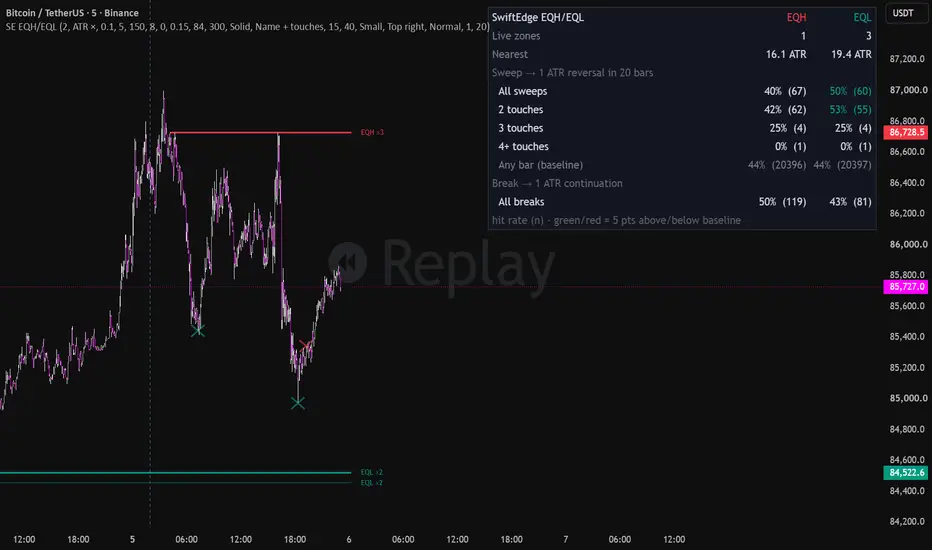
SwiftEdge EQH/EQL Liquidity marks equal highs and equal lows: two or more swing highs (or swing lows) at nearly the same price. Many traders place stops and breakout orders just beyond such levels, so they often act as liquidity that price is drawn to. The script keeps only the levels that are still intact, removes them when they are swept or broken, and measures on your own chart how often a sweep of these levels was actually followed by a reversal.
WHAT IT SHOWS
• Equal highs (EQH) and equal lows (EQL)
Swing highs and lows are found with a pivot of "Swing length" bars on each side. Two swings count as equal when they are within a tolerance, set as a multiple of ATR(14) (0.1 by default) or as a percentage of price, so the same settings work on any symbol and timeframe. Every further swing at the same level adds a touch to the zone. The minimum and maximum number of bars between touches can be set.
• Zones
Each zone spans its touches, from the first touch to a few bars past the current bar, with a level line at the extreme touch (the price that has to be taken out), a dotted line through the touches and a label such as "EQH ×3". When there are more zones than the maximum per side, the one farthest from price is removed. Zones with more touches are shaded stronger, older zones fade slightly, and the nearest EQH above price and the nearest EQL below price are highlighted and shown on the price scale. Hover a label for the level, its distance in ATR, the age of the first and last touch and the relative volume around the touches.
• Sweeps and breaks
A sweep is a bar whose wick trades beyond the level but closes back inside. A break is a bar that closes beyond the level. Either way the zone is removed, so only intact liquidity stays on the chart. Sweeps leave a small × at the wick. Break marks and a dotted trail of the taken level can be switched on.
• Statistics panel
– Live zones and the distance to the nearest EQH and EQL in ATR.
– Sweep → reversal: the share of sweeps that were followed by a move of N × ATR in the reversal direction within a set number of bars, before any bar closed beyond the sweep wick. Shown for all sweeps and split by 2, 3 and 4+ touches.
– Baseline: the same measurement started from every bar. A sweep result is shown green when it is at least 5 percentage points better than the baseline and red when it is 5 points worse (with at least 20 sweeps). This shows whether sweeps of equal highs/lows behaved differently from any other bar on your market, instead of assuming it.
– Break → continuation: the share of breaks that continued N × ATR before closing back across the level.
HOW IT WORKS
1. A swing is confirmed "Swing length" bars after its high or low. A single swing waits for an equal partner. It can no longer pair once price has traded beyond it by more than the tolerance, or after the maximum number of bars.
2. When a new swing is equal to a waiting swing (or to an existing zone), a zone is created (or gets another touch).
3. On every closed bar, live zones are checked: a wick beyond the level with a close back inside is a sweep, a close beyond is a break.
4. The statistics follow each sweep, break and baseline bar until the target is reached, the invalidation close happens, or the time window ends. If the target and the invalidation happen on the same bar, it counts as a miss.
HOW TO USE IT
• Treat live EQH/EQL zones as areas where liquidity is likely resting and price may be drawn to.
• A sweep (wick through, close back) is the classic stop run. Use the panel to see whether sweeps on your symbol and timeframe reversed more often than the baseline, and whether more touches made a difference.
• A break shows that the level did not hold. The continuation row shows how often that led to follow-through.
• Adjust the tolerance to the market: a smaller tolerance gives fewer, cleaner levels; a larger one groups more swings.
SETTINGS
Detection (swing length, tolerance in ATR or percent, bars between touches, maximum zones per side, maximum zone age), zones (EQH/EQL on or off, zone box, minimum height, transparency, shading by touches, age fade, level line and style, line through the touches, label and label text, right extension, nearest highlight, price-scale marks), sweep and break marks, swept-level trail, number of marks kept, colours, label size, and the statistics (target in ATR, time window, panel position and text size). Alerts are available for new EQH/EQL, sweeps and breaks.
LIMITATIONS
• TradingView can only draw objects up to about 10,000 bars back. A zone whose first touch is older than that (for example on 1-minute charts) is drawn from the oldest drawable bar.
• Swings are only known "Swing length" bars after the high or low, so zones appear with that delay and are then drawn back to the first touch. Sweeps and breaks are evaluated on bar close and do not change afterwards.
• Equal highs and lows are a price pattern. The script does not see actual stop orders.
• Statistics describe the history loaded on your chart and depend on the settings, the symbol, the timeframe and the data feed. They are a measurement, not a forecast, and not a trading system.
This script is for analysis and education. It does not provide trading advice, and past behaviour shown on the chart does not imply future results.
WHAT IT SHOWS
• Equal highs (EQH) and equal lows (EQL)
Swing highs and lows are found with a pivot of "Swing length" bars on each side. Two swings count as equal when they are within a tolerance, set as a multiple of ATR(14) (0.1 by default) or as a percentage of price, so the same settings work on any symbol and timeframe. Every further swing at the same level adds a touch to the zone. The minimum and maximum number of bars between touches can be set.
• Zones
Each zone spans its touches, from the first touch to a few bars past the current bar, with a level line at the extreme touch (the price that has to be taken out), a dotted line through the touches and a label such as "EQH ×3". When there are more zones than the maximum per side, the one farthest from price is removed. Zones with more touches are shaded stronger, older zones fade slightly, and the nearest EQH above price and the nearest EQL below price are highlighted and shown on the price scale. Hover a label for the level, its distance in ATR, the age of the first and last touch and the relative volume around the touches.
• Sweeps and breaks
A sweep is a bar whose wick trades beyond the level but closes back inside. A break is a bar that closes beyond the level. Either way the zone is removed, so only intact liquidity stays on the chart. Sweeps leave a small × at the wick. Break marks and a dotted trail of the taken level can be switched on.
• Statistics panel
– Live zones and the distance to the nearest EQH and EQL in ATR.
– Sweep → reversal: the share of sweeps that were followed by a move of N × ATR in the reversal direction within a set number of bars, before any bar closed beyond the sweep wick. Shown for all sweeps and split by 2, 3 and 4+ touches.
– Baseline: the same measurement started from every bar. A sweep result is shown green when it is at least 5 percentage points better than the baseline and red when it is 5 points worse (with at least 20 sweeps). This shows whether sweeps of equal highs/lows behaved differently from any other bar on your market, instead of assuming it.
– Break → continuation: the share of breaks that continued N × ATR before closing back across the level.
HOW IT WORKS
1. A swing is confirmed "Swing length" bars after its high or low. A single swing waits for an equal partner. It can no longer pair once price has traded beyond it by more than the tolerance, or after the maximum number of bars.
2. When a new swing is equal to a waiting swing (or to an existing zone), a zone is created (or gets another touch).
3. On every closed bar, live zones are checked: a wick beyond the level with a close back inside is a sweep, a close beyond is a break.
4. The statistics follow each sweep, break and baseline bar until the target is reached, the invalidation close happens, or the time window ends. If the target and the invalidation happen on the same bar, it counts as a miss.
HOW TO USE IT
• Treat live EQH/EQL zones as areas where liquidity is likely resting and price may be drawn to.
• A sweep (wick through, close back) is the classic stop run. Use the panel to see whether sweeps on your symbol and timeframe reversed more often than the baseline, and whether more touches made a difference.
• A break shows that the level did not hold. The continuation row shows how often that led to follow-through.
• Adjust the tolerance to the market: a smaller tolerance gives fewer, cleaner levels; a larger one groups more swings.
SETTINGS
Detection (swing length, tolerance in ATR or percent, bars between touches, maximum zones per side, maximum zone age), zones (EQH/EQL on or off, zone box, minimum height, transparency, shading by touches, age fade, level line and style, line through the touches, label and label text, right extension, nearest highlight, price-scale marks), sweep and break marks, swept-level trail, number of marks kept, colours, label size, and the statistics (target in ATR, time window, panel position and text size). Alerts are available for new EQH/EQL, sweeps and breaks.
LIMITATIONS
• TradingView can only draw objects up to about 10,000 bars back. A zone whose first touch is older than that (for example on 1-minute charts) is drawn from the oldest drawable bar.
• Swings are only known "Swing length" bars after the high or low, so zones appear with that delay and are then drawn back to the first touch. Sweeps and breaks are evaluated on bar close and do not change afterwards.
• Equal highs and lows are a price pattern. The script does not see actual stop orders.
• Statistics describe the history loaded on your chart and depend on the settings, the symbol, the timeframe and the data feed. They are a measurement, not a forecast, and not a trading system.
This script is for analysis and education. It does not provide trading advice, and past behaviour shown on the chart does not imply future results.

Free live order book heatmap, footprint and CVD for BTC, gold and 7 more markets: swiftedge.uk/bitcoin-order-book-heatmap
免責聲明
這些資訊和出版物並非旨在提供,也不構成TradingView提供或認可的任何形式的財務、投資、交易或其他類型的建議或推薦。請閱讀使用條款以了解更多資訊。
Free live order book heatmap, footprint and CVD for BTC, gold and 7 more markets: swiftedge.uk/bitcoin-order-book-heatmap
免責聲明
這些資訊和出版物並非旨在提供,也不構成TradingView提供或認可的任何形式的財務、投資、交易或其他類型的建議或推薦。請閱讀使用條款以了解更多資訊。