OPEN-SOURCE SCRIPT
已更新 Buyer Control / CVD + Volume Divergence Score v6 (CPeletz)
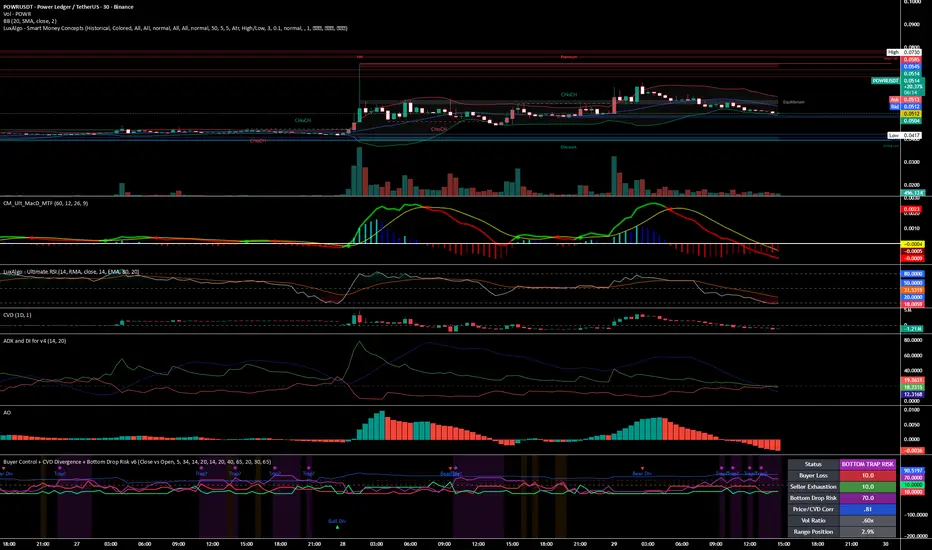
This Pine script is beautiful. The ultimate **buyer/seller control warning system**. It does not predict the future by itself. It watches whether price, volume, and CVD-style buying pressure are agreeing or starting to split apart.
The simple version:
> **Red line = buyers may be losing control.**
> **Green line = sellers may be getting exhausted.**
> **Blue line = price and CVD are agreeing or disagreeing.**
> **Bear Div / Bull Div markers = possible reversal warnings.**
## 1. It builds a fake/proxy CVD
True CVD uses real market buys vs market sells. TradingView usually does not give that on normal candles, so your script estimates it.
It does this:
```pinescript
if close > open
signedVol = volume
else if close < open
signedVol = -volume
else
signedVol = 0
```
So:
* Green candle = count volume as buying pressure
* Red candle = count volume as selling pressure
* Then it adds that up over time with `ta.cum()`
That creates:
```pinescript
cvd = ta.cum(signedVol)
```
So your CVD line is basically:
> “Is volume building more on green candles or red candles?”
It is not perfect order flow, but it is useful for spotting pressure shifts.
## 2. It smooths the CVD
Then it smooths CVD with an EMA:
```pinescript
cvdSmooth = ta.ema(cvd, 5)
```
This makes it less noisy so the script does not overreact to every candle.
## 3. It calculates price slope and CVD slope
This is one of the most important parts.
```pinescript
priceSlope = ta.linreg(close, slopeLen, 0) - ta.linreg(close, slopeLen, 1)
cvdSlope = ta.linreg(cvdSmooth, slopeLen, 0) - ta.linreg(cvdSmooth, slopeLen, 1)
```
In plain English:
* Is price trending up or down?
* Is CVD trending up or down?
The dangerous setup is:
> **Price slope up, CVD slope down.**
That means price is rising, but buying pressure is fading.
That is buyer exhaustion.
## 4. It calculates price/CVD correlation
```pinescript
corrCvd = ta.correlation(ta.change(close), cvdDelta, corrLen)
```
This checks whether price movement and CVD movement agree.
Correlation ranges from:
* **+1.00** = price and CVD strongly agree
* **0.00** = no clear relationship
* **-1.00** = price and CVD are moving opposite
Then your script converts it into a 0–100 visual score:
```pinescript
corrScore = (corrCvd + 1.0) * 50.0
```
So:
* **100** = very strong agreement
* **50** = neutral/choppy
* **0** = strong disagreement
This is your blue line.
If price is rising but the blue line is falling hard, the rally may be unhealthy.
## 5. It checks volume strength
```pinescript
volRatio = volume / averageVolume
```
This tells you whether current volume is strong or weak compared to normal.
Examples:
* **0.50x** = half normal volume
* **1.00x** = normal volume
* **2.00x** = double normal volume
A breakout on low volume is suspicious.
A dump on high volume is more serious.
## 6. It finds swing highs and swing lows
This part:
```pinescript
ph = ta.pivothigh(high, pivotLen, pivotLen)
pl = ta.pivotlow(low, pivotLen, pivotLen)
```
It detects local tops and bottoms.
If `pivotLen = 5`, the script waits for a swing high/low confirmed by 5 candles on each side.
That means the divergence markers appear late by design, because Pine needs confirmation.
## 7. It detects bearish divergence
Bearish divergence means:
> Price makes a higher high, but CVD or volume makes a lower high.
That tells you buyers pushed price higher, but the pressure behind the move was weaker.
The script checks:
```pinescript
currPH > prevPH and currPHCvd < prevPHCvd
```
That means:
* Current price high is higher than previous high
* But current CVD is lower than previous CVD
That creates a **Bear Div** marker.
Bear Div means:
> “Do not chase long. Buyers may be weakening.”
It does **not** mean instant short.
## 8. It detects bullish divergence
Bullish divergence means:
> Price makes a lower low, but CVD improves or sell volume weakens.
The script checks:
```pinescript
currPL < prevPL and currPLCvd > prevPLCvd
```
That means:
* Price made a lower low
* But CVD made a higher low
That creates a **Bull Div** marker.
Bull Div means:
> “Sellers may be weakening. Watch for reclaim.”
It does **not** mean instant buy.
## 9. It builds the Buyer Loss Score
This is the red line.
The script adds points when bearish warning signs appear.
### Buyer Loss gets +25 if:
```pinescript
priceSlope > 0 and cvdSlope < 0
```
Price is rising but CVD is falling.
That is a big warning.
### Buyer Loss gets +20 or +10 if:
```pinescript
corrCvd < 0
corrCvd < 0.25
```
Price and CVD are not agreeing.
### Buyer Loss gets +10 if:
```pinescript
close > close[slopeLen] and volRatio < 0.80
```
Price is rising on weak volume.
### Buyer Loss gets +10 if:
```pinescript
rsi > 55 and rsiSlope < 0 and priceSlope > 0
```
Price is rising, RSI is above 55, but RSI is weakening.
### Buyer Loss gets +25 if:
```pinescript
recentBearDiv
```
A recent bearish divergence happened.
### Buyer Loss gets +10 if:
```pinescript
close < emaControl
```
Price is below the control EMA.
So the red line is basically saying:
> “How many buyer weakness signs are stacking together?”
## 10. It builds the Seller Exhaustion Score
This is the green line.
It adds points when sellers may be running out of pressure.
Seller Exhaustion rises when:
* Price is falling but CVD is rising
* Bullish divergence appears
* Price drops on weak volume
* RSI starts improving while price is still weak
* Price reclaims the EMA
So the green line tells you:
> “Are sellers weakening enough for a possible bounce?”
## How to trade it
### For longs
Good long environment:
* Buyer Loss under **40**
* Seller Exhaustion rising after a dump
* Bull Div appears
* Price reclaims EMA/VWAP/midline
* CVD/correlation improves
* Price makes a higher low
Bad long environment:
* Buyer Loss above **65**
* Bear Div appears
* Price below EMA/VWAP/midline
* Blue correlation line falling
* CVD not confirming price
## Main score meanings
| Score | Meaning |
| --------------------------- | ----------------------------- |
| **Buyer Loss 0–40** | Buyers okay |
| **Buyer Loss 40–65** | Buyers stalling / caution |
| **Buyer Loss 65+** | Buyers likely losing control |
| **Seller Exhaustion 0–40** | Sellers still okay |
| **Seller Exhaustion 40–65** | Sellers slowing |
| **Seller Exhaustion 65+** | Possible bottom/reclaim setup |
## Important limitation
Your script is not true CVD.
It is a **candle-direction CVD proxy**.
So it can help you see pressure changes, but you should always confirm with:
* price structure
* support/resistance
* VWAP or Bollinger basis
* BTC direction
* actual volume
* reclaim/failure candles
## The cleanest way to use it
For a top/reversal warning:
> **Bear Div + Buyer Loss over 65 + price breaks EMA/VWAP = buyers lost control.**
For a bottom/reclaim warning:
> **Bull Div + Seller Exhaustion rising + price reclaims EMA/VWAP = sellers may be losing control.**
The script’s job is not to tell you “buy now” or “sell now.”
Its job is to tell you:
> **Is the move healthy, or is pressure starting to diverge?**
The simple version:
> **Red line = buyers may be losing control.**
> **Green line = sellers may be getting exhausted.**
> **Blue line = price and CVD are agreeing or disagreeing.**
> **Bear Div / Bull Div markers = possible reversal warnings.**
## 1. It builds a fake/proxy CVD
True CVD uses real market buys vs market sells. TradingView usually does not give that on normal candles, so your script estimates it.
It does this:
```pinescript
if close > open
signedVol = volume
else if close < open
signedVol = -volume
else
signedVol = 0
```
So:
* Green candle = count volume as buying pressure
* Red candle = count volume as selling pressure
* Then it adds that up over time with `ta.cum()`
That creates:
```pinescript
cvd = ta.cum(signedVol)
```
So your CVD line is basically:
> “Is volume building more on green candles or red candles?”
It is not perfect order flow, but it is useful for spotting pressure shifts.
## 2. It smooths the CVD
Then it smooths CVD with an EMA:
```pinescript
cvdSmooth = ta.ema(cvd, 5)
```
This makes it less noisy so the script does not overreact to every candle.
## 3. It calculates price slope and CVD slope
This is one of the most important parts.
```pinescript
priceSlope = ta.linreg(close, slopeLen, 0) - ta.linreg(close, slopeLen, 1)
cvdSlope = ta.linreg(cvdSmooth, slopeLen, 0) - ta.linreg(cvdSmooth, slopeLen, 1)
```
In plain English:
* Is price trending up or down?
* Is CVD trending up or down?
The dangerous setup is:
> **Price slope up, CVD slope down.**
That means price is rising, but buying pressure is fading.
That is buyer exhaustion.
## 4. It calculates price/CVD correlation
```pinescript
corrCvd = ta.correlation(ta.change(close), cvdDelta, corrLen)
```
This checks whether price movement and CVD movement agree.
Correlation ranges from:
* **+1.00** = price and CVD strongly agree
* **0.00** = no clear relationship
* **-1.00** = price and CVD are moving opposite
Then your script converts it into a 0–100 visual score:
```pinescript
corrScore = (corrCvd + 1.0) * 50.0
```
So:
* **100** = very strong agreement
* **50** = neutral/choppy
* **0** = strong disagreement
This is your blue line.
If price is rising but the blue line is falling hard, the rally may be unhealthy.
## 5. It checks volume strength
```pinescript
volRatio = volume / averageVolume
```
This tells you whether current volume is strong or weak compared to normal.
Examples:
* **0.50x** = half normal volume
* **1.00x** = normal volume
* **2.00x** = double normal volume
A breakout on low volume is suspicious.
A dump on high volume is more serious.
## 6. It finds swing highs and swing lows
This part:
```pinescript
ph = ta.pivothigh(high, pivotLen, pivotLen)
pl = ta.pivotlow(low, pivotLen, pivotLen)
```
It detects local tops and bottoms.
If `pivotLen = 5`, the script waits for a swing high/low confirmed by 5 candles on each side.
That means the divergence markers appear late by design, because Pine needs confirmation.
## 7. It detects bearish divergence
Bearish divergence means:
> Price makes a higher high, but CVD or volume makes a lower high.
That tells you buyers pushed price higher, but the pressure behind the move was weaker.
The script checks:
```pinescript
currPH > prevPH and currPHCvd < prevPHCvd
```
That means:
* Current price high is higher than previous high
* But current CVD is lower than previous CVD
That creates a **Bear Div** marker.
Bear Div means:
> “Do not chase long. Buyers may be weakening.”
It does **not** mean instant short.
## 8. It detects bullish divergence
Bullish divergence means:
> Price makes a lower low, but CVD improves or sell volume weakens.
The script checks:
```pinescript
currPL < prevPL and currPLCvd > prevPLCvd
```
That means:
* Price made a lower low
* But CVD made a higher low
That creates a **Bull Div** marker.
Bull Div means:
> “Sellers may be weakening. Watch for reclaim.”
It does **not** mean instant buy.
## 9. It builds the Buyer Loss Score
This is the red line.
The script adds points when bearish warning signs appear.
### Buyer Loss gets +25 if:
```pinescript
priceSlope > 0 and cvdSlope < 0
```
Price is rising but CVD is falling.
That is a big warning.
### Buyer Loss gets +20 or +10 if:
```pinescript
corrCvd < 0
corrCvd < 0.25
```
Price and CVD are not agreeing.
### Buyer Loss gets +10 if:
```pinescript
close > close[slopeLen] and volRatio < 0.80
```
Price is rising on weak volume.
### Buyer Loss gets +10 if:
```pinescript
rsi > 55 and rsiSlope < 0 and priceSlope > 0
```
Price is rising, RSI is above 55, but RSI is weakening.
### Buyer Loss gets +25 if:
```pinescript
recentBearDiv
```
A recent bearish divergence happened.
### Buyer Loss gets +10 if:
```pinescript
close < emaControl
```
Price is below the control EMA.
So the red line is basically saying:
> “How many buyer weakness signs are stacking together?”
## 10. It builds the Seller Exhaustion Score
This is the green line.
It adds points when sellers may be running out of pressure.
Seller Exhaustion rises when:
* Price is falling but CVD is rising
* Bullish divergence appears
* Price drops on weak volume
* RSI starts improving while price is still weak
* Price reclaims the EMA
So the green line tells you:
> “Are sellers weakening enough for a possible bounce?”
## How to trade it
### For longs
Good long environment:
* Buyer Loss under **40**
* Seller Exhaustion rising after a dump
* Bull Div appears
* Price reclaims EMA/VWAP/midline
* CVD/correlation improves
* Price makes a higher low
Bad long environment:
* Buyer Loss above **65**
* Bear Div appears
* Price below EMA/VWAP/midline
* Blue correlation line falling
* CVD not confirming price
## Main score meanings
| Score | Meaning |
| --------------------------- | ----------------------------- |
| **Buyer Loss 0–40** | Buyers okay |
| **Buyer Loss 40–65** | Buyers stalling / caution |
| **Buyer Loss 65+** | Buyers likely losing control |
| **Seller Exhaustion 0–40** | Sellers still okay |
| **Seller Exhaustion 40–65** | Sellers slowing |
| **Seller Exhaustion 65+** | Possible bottom/reclaim setup |
## Important limitation
Your script is not true CVD.
It is a **candle-direction CVD proxy**.
So it can help you see pressure changes, but you should always confirm with:
* price structure
* support/resistance
* VWAP or Bollinger basis
* BTC direction
* actual volume
* reclaim/failure candles
## The cleanest way to use it
For a top/reversal warning:
> **Bear Div + Buyer Loss over 65 + price breaks EMA/VWAP = buyers lost control.**
For a bottom/reclaim warning:
> **Bull Div + Seller Exhaustion rising + price reclaims EMA/VWAP = sellers may be losing control.**
The script’s job is not to tell you “buy now” or “sell now.”
Its job is to tell you:
> **Is the move healthy, or is pressure starting to diverge?**
發行說明
Chart Update發行說明
Buyer Control + CVD Divergence + Bottom Drop Risk is a momentum and pressure-warning indicator designed to show when buyers are losing control, when sellers may be getting exhausted, and when a “bottom” may only be compression before another breakdown.The indicator uses price action, volume, RSI momentum, EMA control, a candle-direction CVD proxy, price/CVD correlation, swing high/low divergence, range compression, ATR compression, and range position to create simple warning scores.
Main signals:
Red line — Buyer Loss Score:
Measures whether buyers are weakening. A low score means buyers are mostly okay. A score above 40 means the move may be stalling. A score above 65 means buyers may be losing control.
Green line — Seller Exhaustion Score:
Measures whether sellers are weakening after a dump. A rising green score can help identify a possible bottoming or bounce setup, but price should still reclaim support before entering.
Blue line — Price/CVD Correlation Score:
Shows whether price and buying pressure are agreeing. A high score means price and CVD are moving together. A falling or low score means the move may be unhealthy or unsupported.
Purple line — Bottom Drop Risk Score:
Measures whether price is compressing near the bottom of a range while buyers are weak. A high purple score means the “bottom” may be a trap and could break down.
Bear Div:
Appears when price makes a higher high, but CVD or volume does not confirm. This warns that buyers may be losing strength.
Bull Div:
Appears when price makes a lower low, but CVD improves or sell volume weakens. This warns that sellers may be getting tired.
Trap?:
Appears when price is compressed near the bottom of a range and buyer control is weak. This warns that the bottom may not be real accumulation.
Drop:
Appears when a bottom trap setup breaks down through the range low on stronger volume.
Simple reading:
Buyer Loss under 40 = buyers mostly okay.
Buyer Loss 40–65 = caution, move may be stalling.
Buyer Loss over 65 = buyers may be losing control.
Seller Exhaustion rising = sellers may be weakening.
Bottom Drop Risk over 65 = bottom may be a trap.
Bottom Drop Confirmed = compressed range broke lower.
This indicator is not a guaranteed buy or sell signal. It is a warning system. Use it with support/resistance, VWAP or EMA, market structure, BTC direction, and reclaim/failure levels.
發行說明
Buyer Control + CVD Divergence + Bottom Drop Risk is a momentum and pressure-warning indicator designed to show when buyers are losing control, when sellers may be getting exhausted, and when a “bottom” may only be compression before another breakdown.The indicator uses price action, volume, RSI momentum, EMA control, a candle-direction CVD proxy, price/CVD correlation, swing high/low divergence, range compression, ATR compression, and range position to create simple warning scores.
Main signals:
Red line — Buyer Loss Score:
Measures whether buyers are weakening. A low score means buyers are mostly okay. A score above 40 means the move may be stalling. A score above 65 means buyers may be losing control.
Green line — Seller Exhaustion Score:
Measures whether sellers are weakening after a dump. A rising green score can help identify a possible bottoming or bounce setup, but price should still reclaim support before entering.
Blue line — Price/CVD Correlation Score:
Shows whether price and buying pressure are agreeing. A high score means price and CVD are moving together. A falling or low score means the move may be unhealthy or unsupported.
Purple line — Bottom Drop Risk Score:
Measures whether price is compressing near the bottom of a range while buyers are weak. A high purple score means the “bottom” may be a trap and could break down.
Bear Div:
Appears when price makes a higher high, but CVD or volume does not confirm. This warns that buyers may be losing strength.
Bull Div:
Appears when price makes a lower low, but CVD improves or sell volume weakens. This warns that sellers may be getting tired.
Trap?:
Appears when price is compressed near the bottom of a range and buyer control is weak. This warns that the bottom may not be real accumulation.
Drop:
Appears when a bottom trap setup breaks down through the range low on stronger volume.
Simple reading:
Buyer Loss under 40 = buyers mostly okay.
Buyer Loss 40–65 = caution, move may be stalling.
Buyer Loss over 65 = buyers may be losing control.
Seller Exhaustion rising = sellers may be weakening.
Bottom Drop Risk over 65 = bottom may be a trap.
Bottom Drop Confirmed = compressed range broke lower.
This indicator is not a guaranteed buy or sell signal. It is a warning system. Use it with support/resistance, VWAP or EMA, market structure, BTC direction, and reclaim/failure levels.
Plain-English way to use it
For longs:
You want red low, green rising after a dump, blue healthy, and purple low.
For avoiding bad longs:
Do not long when purple is high, red is rising, and price is still under EMA/VWAP.
For bottom traps:
The dangerous setup is:
Price dumps → chops sideways near the low → volume dries up → buyers fade → purple line rises → support breaks.
That is exactly what the new Bottom Drop Risk Score is built to catch.
發行說明
Bottom Risk now reduces itself when Buyer Loss is low, MACD improves, CVD is healthy, and price is above EMA. That should reduce false “bottom risk” warnings during healthy pullbacks like HUSDT.開源腳本
秉持TradingView一貫精神,這個腳本的創作者將其設為開源,以便交易者檢視並驗證其功能。向作者致敬!您可以免費使用此腳本,但請注意,重新發佈代碼需遵守我們的社群規範。

免責聲明
這些資訊和出版物並非旨在提供,也不構成TradingView提供或認可的任何形式的財務、投資、交易或其他類型的建議或推薦。請閱讀使用條款以了解更多資訊。
開源腳本
秉持TradingView一貫精神,這個腳本的創作者將其設為開源,以便交易者檢視並驗證其功能。向作者致敬!您可以免費使用此腳本,但請注意,重新發佈代碼需遵守我們的社群規範。
免責聲明
這些資訊和出版物並非旨在提供,也不構成TradingView提供或認可的任何形式的財務、投資、交易或其他類型的建議或推薦。請閱讀使用條款以了解更多資訊。