OPEN-SOURCE SCRIPT
已更新 Bollinger Band Lathe
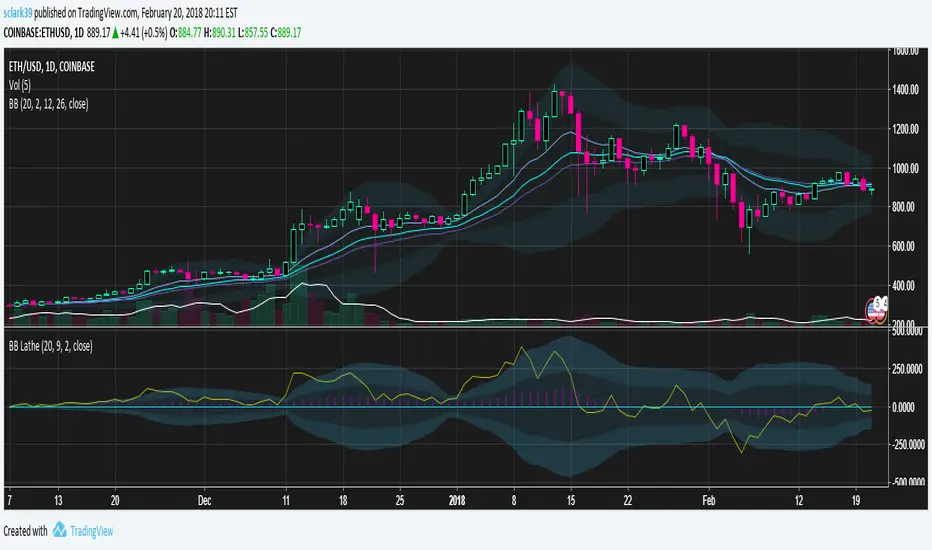
Bollinger Bands shown with a horizontal basis, to make it easier to see how volatility is changing and identify squeeze opportunities.
There is a histogram (purple) which shows how the basis is changing, and a price line (yellow) showing the location of the price within the bollinger bands.
It is tuned to 2 STDEV, but shows the area within 1 STDEV a different color to help visualize when the price is near the extremes of the bands.
By default this uses an exponential moving average to calculate the bollinger basis, but this can be changed in the options.
There is a histogram (purple) which shows how the basis is changing, and a price line (yellow) showing the location of the price within the bollinger bands.
It is tuned to 2 STDEV, but shows the area within 1 STDEV a different color to help visualize when the price is near the extremes of the bands.
By default this uses an exponential moving average to calculate the bollinger basis, but this can be changed in the options.
發行說明
Made it so the inner bollinger envelope multiple can be modified, and added an optional alternate calculation for stdev which uses the two-pass algorithm which I believe is more accurate than the builtin. Default options are to enable the custom stdev implementation and use EMA for the bollinger basis.發行說明
Updating to apply a scale factor while calculating the bollinger mean and deviation to increase precision with tiny cryptocurrency exchange rates.開源腳本
秉持TradingView一貫精神,這個腳本的創作者將其設為開源,以便交易者檢視並驗證其功能。向作者致敬!您可以免費使用此腳本,但請注意,重新發佈代碼需遵守我們的社群規範。

免責聲明
這些資訊和出版物並非旨在提供,也不構成TradingView提供或認可的任何形式的財務、投資、交易或其他類型的建議或推薦。請閱讀使用條款以了解更多資訊。
免責聲明
這些資訊和出版物並非旨在提供,也不構成TradingView提供或認可的任何形式的財務、投資、交易或其他類型的建議或推薦。請閱讀使用條款以了解更多資訊。