RSI Split Candles - Multi-Timeframe
WHAT THIS SCRIPT DOES
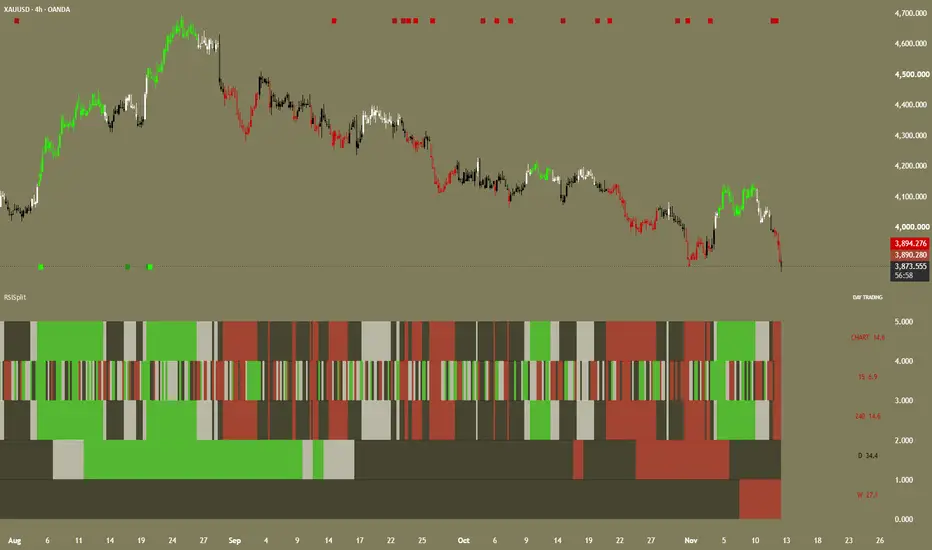
This indicator replaces your price chart with a custom candle colouring derived from a private RSI engine, splits every candle into the portion bought and the portion sold inside that bar, and stacks five timeframes of the same reading into a compact strip below price.
The candles tell you where momentum sits. The split tells you who moved the price. The strip tells you whether the higher timeframes agree. Together they answer three questions that are normally spread across three separate indicators, without cluttering your chart with moving averages, bands or price anchored drawings.
Unlike the many RSI colouring scripts that merely paint a candle by a single reading, this one carries two independent information layers on the same candle, and a completely separate five row multi timeframe matrix that never interferes with either.
READ THIS FIRST
Before anything else, one rule decides whether this indicator behaves as intended.
Every trade profile names two timeframes. The first one is the higher timeframe and it only arms the setup. The second one is the lower timeframe and it is the one that triggers the signal. Your chart must be opened on the second, lower timeframe of the profile you selected. That is where the trigger is calculated, that is where the marker is printed, and that is the only chart on which the signal will agree with the trigger row in the strip.
So for scalping, which uses four hours and fifteen minutes, open a fifteen minute chart. For day trading, which uses daily and four hours, open a four hour chart. For micro scalping, which uses fifteen minutes and one minute, open a one minute chart. For position trading, which uses weekly and daily, open a daily chart.
If you open a chart on the higher timeframe instead, the trigger timeframe sits below your chart, the engine cannot read it separately, and the signals you see are not the ones the profile was designed to produce. This single mistake accounts for almost every report of missing or unexpected signals.
HOW IT WORKS
The reading is a range thrust RSI rather than a standard close to close RSI. Instead of measuring only the distance between one close and the next, it first asks which boundary of the lookback range was extended on this bar. If the bar made a new lookback high, the full range is credited as upward thrust. If it made a new lookback low, the full range is credited as downward thrust. If the bar stayed inside the previous range, the ordinary close to close change is used.
That change matters. A close to close RSI treats a wide bar that closes a cent higher as almost neutral, because it only sees the cent. A range thrust reading sees that the bar opened low, drove to a new high and closed near it, and credits the whole range as buying pressure. The result is an oscillator that tracks directional conviction instead of net displacement, and it turns ahead of the classic calculation when a strong bar reverses inside a lookback window.
Both the numerator and the denominator of the ratio are smoothed with a running mean, and the ratio is rescaled so that fifty is neutral. The reading therefore behaves like an RSI, respects the same seventy and thirty thresholds, and remains readable to anyone familiar with the classic oscillator, while reacting to a different part of the price action.
The buyer and seller split is a separate measurement. For each chart bar the script samples a lower timeframe inside the bar, accumulates the volume traded at or above the bar open as buying and the volume traded below it as selling, and converts the two totals into a share of the bar. That share decides where the boundary between the buyer block and the seller block is drawn. The buying block is painted solid and the selling block is painted faded, so a bar that rose on heavy buying looks almost entirely saturated while a bar that closed higher on weak participation looks mostly faded. The boundary position is the information, and it is visible at a glance without reading a number.
The five row strip runs the same range thrust calculation independently on five timeframes. Each row has its own length setting, its own colours, its own drawing style and its own visibility switch, and each row is computed from its own timeframe data. The rows are analysis only. They never generate a signal, never suppress a signal and never alter the candle colouring.
The signal engine is separate again. It uses a two leg structure. An arming leg drawn from a higher timeframe decides whether the market is permitted to trade in a direction at all. A trigger leg drawn from a lower timeframe decides when. Both legs require the reading to be on the correct side of its midline and both legs require a fast dual exponential moving average alignment to agree, and a signal is printed only when the arm is valid and the trigger produces an event.
Two grades of signal are produced. The first impulse is the initial cross of the midline by the trigger leg, and it is drawn in a darker tone. The extreme is the cross of the overbought or oversold threshold by the trigger leg, and it is drawn in the brighter tone. The first impulse always takes priority. If both events are pending at the same moment, the impulse prints and the extreme is re armed, so the earlier entry is never silently replaced by the later one.
THE CANDLES
Every candle is coloured by the reading on the chart timeframe. Four states exist, and each has its own colour setting.
Above the overbought level the candle is bright green by default. Between fifty and the overbought level it is white by default. Between the oversold level and fifty it is black by default. Below the oversold level it is red by default.
The defaults follow the familiar convention used by volume and pressure tools. Green marks strength above the upper threshold, white marks mild strength, black marks mild weakness and red marks outright weakness. Black is intentionally used for the weaker positive half because it reads as neutral on light themes and stays visible on dark themes without competing with the stronger colours. Every one of the four is user editable, so a light theme user can replace black with a colour that suits the background.
The candle is drawn on top of the native candle. The native candles must remain enabled because the indicator does not draw its own borders at the true price extremes, so the native wick and frame remain visible beneath the painting. This is deliberate. The script covers the native body precisely so that no border shows, and the wick transparency setting controls how much of the native wick remains visible through the coloured body.
THE BUY AND SELL SPLIT
The split divides the candle body into a buyer block and a seller block. The position of the dividing line within the body is the buyer share of the bar.
The buyer block is painted in the same colour as the zone colour of the candle, fully opaque. The seller block is painted in the same zone colour but faded. The faded tone is not real transparency in the default mode. It is a pre blended colour computed by mixing the zone colour with the pre blend colour at the seller transparency ratio, then painted fully opaque. The reason is that a genuinely transparent block would allow the native candle behind it to bleed through and the result would not match the appearance of a dedicated pane. Pre blending produces a flat and predictable tone that looks identical to transparency while remaining solid on the chart.
The seller transparency setting controls how faded the seller block appears. Fifty five is the default and corresponds to a solid buyer block and a clearly faded seller block. Lower values make the seller block more saturated and higher values make it fade further toward the pre blend colour.
The pre blend colour is the colour the faded block is mixed with, and it should be set to the exact background colour of your chart. The default is olive, matching the light olive theme the script was developed on. If your chart background is white, set it to white. If it is dark, set it to that dark tone. This one setting is what makes the faded blocks integrate seamlessly rather than sitting inside a visible box of the wrong colour.
The split anchor decides which end of the body the buyer block occupies. With the bottom anchor the buyer block always sits at the bottom and the seller share stacks above it, which is the conventional way volume split tools are read. With the close side anchor the buyer block hugs the direction of the close, which reverses the stacking on down bars.
The split area decides what is divided. Body splits only the candle body. Full range splits the entire high to low range of the bar, which makes the split a commentary on the whole bar rather than only its body.
A divider line can be drawn at the boundary between the two blocks. It is off by default, and its colour defaults to black with a width of one pixel.
THE FIVE ROW MATRIX
Five rows are stacked in a single pane beneath price. Row one is always the chart timeframe. Rows two to five default to fifteen minutes, four hours, daily and weekly, and each is editable.
The order runs from the fastest observation at the top to the slowest at the bottom. This is deliberate. When the market is aligned, all five rows share the same colour and the pane reads as a solid band. When it is not aligned, the rows disagree and the disagreement is visible as horizontal banding. That banding is the actual signal content of the matrix. A trader looking for a long entry wants the upper rows to turn before the lower rows confirm, and a trader looking for exhaustion wants to see the lower rows stay extended while the upper rows fade.
Each row carries four colours for the same four states, all defaulting to the same four colours as the candles. Bright green above the overbought level, white between fifty and overbought, black between oversold and fifty, and red below the oversold level. Each row also carries its own length, and the length defaults to fourteen on all five rows. Changing the length of one row changes only that row. The rows are independent of the candles and independent of the signals.
Each row can be set to area, columns or histogram. Area fills the row as a continuous band and is the default because it makes the disagreement between timeframes easiest to read at a glance. Columns and histogram draw one mark per candle and are useful when you want to see the exact bar at which a row changed colour.
Each row can be hidden independently. Hiding a row also hides its value label, so the readout on the right of the pane always matches what is drawn.
Row transparency defaults to fifty five and applies to all five rows. Row width defaults to one and controls the thickness of the columns and histogram styles. The row separators are off by default, and their colour defaults to dark grey.
THE ROWS ARE ANALYSIS ONLY
This is worth stating plainly because it is the most frequently misunderstood part of the script. The five rows do not feed the signal engine in any way. They are a visual matrix for reading multi timeframe structure. Changing a row length, a row colour or a row timeframe will never change a single marker on the price chart. Likewise the candles and their split never influence the signals.
THE SIGNALS
Two legs decide a signal.
The arming leg is taken from a higher timeframe. It requires the reading on that timeframe to be above fifty for a long setup or below fifty for a short setup, and it requires the fast dual exponential moving average alignment on that same timeframe to agree with the direction. When both are true the setup is armed, and it stays armed until one of the two conditions fails. Arming is a live state and not an event. It does not print anything by itself, it can close and reopen, and reopening does not create a signal.
The trigger leg is taken from a lower timeframe. It requires the reading on that timeframe to cross the midline from below for a long setup or from above for a short setup, and it requires the fast dual exponential moving average alignment on that same timeframe to agree. The trigger leg evaluates its own moving average alignment independently of the arming leg, which means a long setup requires agreement on both timeframes and not merely on the higher one. This prevents signals from firing into a lower timeframe that is still trending against the higher one.
The two moving average pairs are deliberately not exposed as inputs. They are short exponential moving averages used as a directional agreement filter, and they exist to stop the oscillator from generating entries when price structure has not turned. Because the script is published open source, the exact periods are visible in the source. They are not presented as settings because changing them produces a different indicator with different behaviour and not a personal preference.
THE PROFILES
Four trade profiles are provided, each with a fixed arming and trigger pair, plus a custom profile.
Position trading arms on the weekly and triggers on the daily, with the arming leg using a shorter lookback than the default because the weekly bar contains far more price action than a daily bar. This is the swing and position profile. It produces the fewest signals and each one covers the widest move.
Day trading arms on the daily and triggers on the four hour. This is the profile for traders who hold for part of a day and want the daily context to govern shorter entries.
Scalping arms on the four hour and triggers on the fifteen minute. This is the profile for intraday work where the daily is too slow and the fifteen minute alone is too noisy.
Micro scalping arms on the fifteen minute and triggers on the one minute. This is the fastest profile and is intended for one minute execution with quarter hour context.
The custom profile accepts any higher and lower pair. It affects the signals only. It never touches the candles and never touches the rows.
THE NON REPAINTING CONTROLS
Three switches govern how honest and how fast the script is. All three are on by default.
Wait for candle close confirmation holds every value at its last closed reading while the bar is forming, and refuses to draw the forming candle. With this on, nothing you see can change once it appears. With it off, the script updates live and history on the current bar is provisional.
Let a pending cross wait for the filters allows a cross that occurs while a filter is still closed to be remembered and printed as soon as everything aligns. This is what lets the arming timeframe and the trigger timeframe hand over to each other across several bars. With it off, a signal prints only on the exact bar of the cross and is dropped if a filter is not open at that instant.
Arm uses the developing period rebuilds the arming leg bar by bar on your chart instead of waiting for the higher timeframe to close. Every completed higher timeframe period produces exactly the same value as the closed data, so history is identical. Between closes, the arming leg moves as the higher timeframe bar develops, which makes the arm react immediately rather than at the next close.
The trade off is stated openly. The closed mode is strictly conservative because the arm cannot change until the higher timeframe bar finishes, so a setup may appear late. The developing mode reacts immediately but the arm can close again inside the period if price reverses. Both are legitimate. The developing mode is the default because the closed mode produces too few signals on the slowest profile.
THE MARKERS
Signals print as a marker chosen from square, circle, diamond, triangle up, triangle down, cross, x cross and flag. The default is a small square, and the size is fixed at tiny by the script because marker size must be a literal constant in Pine and cannot be an input without duplicating every marker call.
Placement has three modes. Pane edges puts bullish markers at the bottom of the chart and bearish markers at the top, which is the default and keeps the candles completely clear. Price offset anchors bullish markers a fixed distance below the lowest low of a lookback window and bearish markers a fixed distance above the highest high, with the distance measured in average true range so it scales with volatility. Bar offset puts bullish markers just below the bar and bearish markers just above it.
Bullish markers are always below price and bearish markers always above it. The marker never overlaps the candles in any mode.
Marker colours are set by grade. First impulse bullish is a dark green by default and first impulse bearish is a dark red. Extreme bullish is a bright green by default and extreme bearish is red. The darker tones signal an earlier and less confirmed entry while the brighter tones signal an extended condition.
THE VALUE LABELS AND THE PROFILE LABEL
A set of small text labels is drawn to the right of the last candle, offset by a configurable number of bars. Each label shows the reading of one row, coloured by that row zone colour, with the timeframe name in front. The first row always reads CHART. These labels exist so the matrix values can be read as numbers without hovering.
The profile label prints the active trading profile in capitals above the rows. Its colour defaults to white and its size defaults to small, and both are editable so it remains readable on a light theme. It is on by default and can be turned off.
Every input in the script suppresses its value from the TradingView status line by code, so the status line stays clean regardless of the platform checkbox.
THE ALERTS
Seven alert conditions are provided. First impulse bullish fires when the arming leg is bullishly armed and the trigger leg crosses the midline upward. Extreme signal bullish fires when the arming leg is bullishly armed and the trigger leg crosses the overbought level upward. The two bearish conditions mirror them. Three further conditions, any bullish signal, any bearish signal and any signal, fire on either grade and either direction.
Two dynamic alert messages are also produced, naming the active profile, the direction and the grade, so a single alert can be used across all profiles. They fire once per bar close, consistent with the non repainting default.
HOW TO USE IT
Start by selecting the profile that matches your holding period and not the profile that matches your chart. The profile defines which timeframes arm and trigger, and that definition does not change when you change charts.
For position trading and swing trading, use the daily or the weekly chart with the position trading profile. Read the five rows to confirm that the weekly and the daily agree with your direction before acting on a daily trigger. A typical use is to wait until the weekly row and the daily row are the same colour, then take the first impulse marker on the daily as the entry and treat the extreme marker as a signal that the move is already extended. A stop placed beyond the opposite extreme of the recent swing bars, with the split showing whether the recent bars were bought or sold, is a coherent way to combine the two layers without inventing rules beyond what the tool measures.
For day trading, use the four hour chart with the day trading profile. The four hour trigger aligns with the chart, so the marker appears on the bar where the four hour reading crosses and matches the reading you can see in the strip row for the four hour. The daily arming leg governs the direction.
For intraday scalping, use the fifteen minute chart with the scalping profile, or the one minute chart with the micro scalping profile. On these charts the split becomes the more useful layer, because the candle colour changes often while the split shows whether each bar was actually bought or merely drifted.
For investing, use the weekly chart with the position trading profile and read the strip for the multi timeframe structure. On a weekly chart the position trading trigger, which is the daily, sits below the chart and is therefore taken from the chart own series, which means a weekly signal requires the weekly reading to cross rather than a daily one.
The most common misuse is selecting a fast profile while analysing a slow chart, or a slow profile while analysing a fast chart. If a fifteen minute chart shows only a handful of signals in a week with the day trading profile, that is correct behaviour because the trigger is the four hour and not the chart. Use the scalping profile on fifteen minutes.
WHICH MARKETS AND WHICH STYLES
The script is symbol agnostic. It works on any instrument TradingView provides, including crypto, forex, indices, equities, futures and commodities, because the calculation uses only the source price and volume of the chart it is applied to.
It is suitable for scalping on one minute to five minute charts with the micro scalping profile, for intraday trading on fifteen minute to one hour charts with the scalping profile, for day trading on four hour charts with the day trading profile, for swing trading on daily charts with the position trading profile, and for position or investment decisions on daily to weekly charts with the position trading profile.
Volume based features require a symbol that reports volume. On symbols without volume, such as some indices, the volume weighted option and the volume based split produce degenerate values, and the split should be interpreted with that limitation in mind. The colouring, the rows and the signals are unaffected because they do not depend on volume.
WHAT MAKES IT ORIGINAL
The originality is the combination, and specifically the way the three layers are kept strictly independent.
The reading engine is a range thrust variant and not a close to close RSI. It credits full lookback range extension rather than net displacement, which changes when the oscillator crosses its thresholds and is the reason the colouring turns earlier than a conventional RSI colouring on reversal bars.
The split is measured from lower timeframe data inside each bar rather than approximated from the open, the close and the high and low. It is pre blended rather than transparent so that it renders identically on any chart background, which is why the faded seller block looks the same on a light theme and a dark one.
The five row matrix is fully independent, with per row timeframe, length, style and colours, and it is documented as analysis only, which removes the ambiguity that most multi timeframe scripts leave in place.
The signal engine is a two leg arming and trigger system in which both legs independently require a directional moving average alignment, and in which the first impulse always takes precedence over the extreme, so an early entry is never replaced by a later and more extended one.
The three non repainting controls are exposed rather than hidden, and the developing arming period is implemented by rebuilding the higher timeframe bar from chart data rather than reading a partially formed higher timeframe value, which produces identical history at every higher timeframe close while still moving between closes.
DISCLAIMER
This indicator is a technical analysis tool, published for study and for use on your own charts. It is not a trading system, not a recommendation and not investment advice.
Trading carries risk. Foreign exchange, cryptocurrencies, indices, equities, futures, commodities and any leveraged instrument can lose money faster than most people expect, and a leveraged position can lose more than the deposit behind it. Every decision you take with this tool is yours, the size of every position, the placement of every stop and the management of every trade.
The script is provided as it is, without warranty. No promise is made that it is free of error, that the data it reads is correct, that the split proportions reflect the real distribution of buying and selling, or that a reading you see here will look the same on another feed, another platform or another time zone.
The repainting controls exist so that closed bars stay fixed. The open bar is provisional until it closes and may still change, which is true of any tool that reads a live price. Signals can also differ between timeframes and data feeds, so test on the instrument and the chart you actually trade.
If you add this indicator to a chart, you do so on your own judgement and at your own risk.

免責聲明
這些資訊和出版物並非旨在提供,也不構成TradingView提供或認可的任何形式的財務、投資、交易或其他類型的建議或推薦。請閱讀使用條款以了解更多資訊。
免責聲明
這些資訊和出版物並非旨在提供,也不構成TradingView提供或認可的任何形式的財務、投資、交易或其他類型的建議或推薦。請閱讀使用條款以了解更多資訊。