Momentum Trade Planner [EMA9 + RSI | OB | FVG]
OVERVIEW
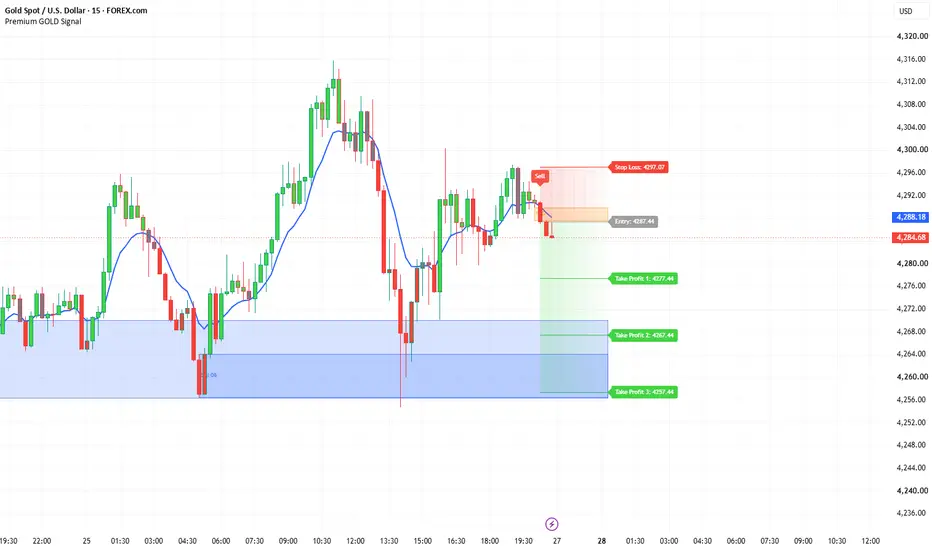
Momentum Trade Planner combines a simple momentum entry (9 EMA + RSI) with automatic trade planning (Stop Loss and three Take Profit levels) and market-structure context (Order Blocks and Fair Value Gaps). The goal is to show, on one chart, where a momentum setup appears, where it would be invalidated, where the targets sit, and which nearby zones may act as support or resistance.
It was designed for XAUUSD on the 15-minute chart, but all settings are adjustable for other symbols and timeframes.
HOW THE SIGNALS WORK
BUY: a candle closes above the 9 EMA while RSI (14) is above 50.
SELL: a candle closes below the 9 EMA while RSI (14) is below 50.
A signal appears only on the candle where the condition first becomes true, and only after that candle closes. Signals do not repaint.
TRADE LEVELS
When a signal appears, the script draws a trade plan:
- Entry: the close of the signal candle.
- Stop Loss: below the lowest low of the previous 4 candles (BUY) or above the highest high of the previous 4 candles (SELL). An optional buffer can be added.
- Take Profits: three fixed-distance targets. With the default step of 10.0 on XAUUSD, a BUY at 4000 gives TP1 4010, TP2 4020, TP3 4030 (and the reverse for SELL).
The risk zone (Entry to SL) is shaded red and the reward zone (Entry to TP3) is shaded green. Small dots mark the candles where each TP or the SL is reached. Only the latest trade is drawn; when a new signal fires, the previous drawings are removed to keep the chart clean.
ORDER BLOCKS
Swing highs and lows are confirmed using the "Swing length" setting. When price closes beyond a swing high, the lowest candle between the swing and the break is marked as a Bullish Order Block. When price closes beyond a swing low, the highest candle before the break is marked as a Bearish Order Block. An Order Block is removed once a candle closes through it.
FAIR VALUE GAPS
A Bullish FVG forms when a candle's low is above the high from two candles earlier; a Bearish FVG is the opposite. Gaps smaller than a set fraction of ATR are ignored to reduce noise. An FVG is removed once price fills it completely.
HOW TO USE IT
The EMA/RSI signal identifies momentum; the Order Blocks and FVGs provide context. For example, a BUY signal forming as price reacts from a Bullish Order Block or Bullish FVG has additional confluence, while a BUY signal running directly into a Bearish Order Block overhead may have limited room to reach its targets. Use the zones to judge the quality of each signal rather than taking every signal mechanically.
SETTINGS
- EMA length, RSI length and RSI level
- SL lookback and SL buffer
- TP step (distance between targets)
- Option to hide same-direction signals while a trade is active
- Zone colors, transparency and fade length
- Candle coloring by trend
- Order Block swing length and maximum count
- FVG minimum size (× ATR) and maximum count
- Option to keep or remove mitigated zones
ALERTS
Alerts are available for Buy, Sell, TP hit and SL hit. For alert messages that include the exact Entry, SL and TP prices, create an alert using "Any alert() function call".
NOTES
- TP levels use a fixed price distance, so the reward-to-risk ratio varies from trade to trade depending on the Stop Loss distance.
- If a single candle touches both the Stop Loss and a Take Profit, the script counts the Stop Loss first, since the order of prices inside one candle cannot be known.
- On instruments other than XAUUSD, adjust the TP step to suit the instrument's price scale.
DISCLAIMER
This indicator is a tool for chart analysis and education. It does not guarantee results and is not financial advice. Always test on historical data and use proper risk management.
Momentum Trade Planner combines a simple momentum entry (9 EMA + RSI) with automatic trade planning (Stop Loss and three Take Profit levels) and market-structure context (Order Blocks and Fair Value Gaps). The goal is to show, on one chart, where a momentum setup appears, where it would be invalidated, where the targets sit, and which nearby zones may act as support or resistance.
It was designed for XAUUSD on the 15-minute chart, but all settings are adjustable for other symbols and timeframes.
HOW THE SIGNALS WORK
BUY: a candle closes above the 9 EMA while RSI (14) is above 50.
SELL: a candle closes below the 9 EMA while RSI (14) is below 50.
A signal appears only on the candle where the condition first becomes true, and only after that candle closes. Signals do not repaint.
TRADE LEVELS
When a signal appears, the script draws a trade plan:
- Entry: the close of the signal candle.
- Stop Loss: below the lowest low of the previous 4 candles (BUY) or above the highest high of the previous 4 candles (SELL). An optional buffer can be added.
- Take Profits: three fixed-distance targets. With the default step of 10.0 on XAUUSD, a BUY at 4000 gives TP1 4010, TP2 4020, TP3 4030 (and the reverse for SELL).
The risk zone (Entry to SL) is shaded red and the reward zone (Entry to TP3) is shaded green. Small dots mark the candles where each TP or the SL is reached. Only the latest trade is drawn; when a new signal fires, the previous drawings are removed to keep the chart clean.
ORDER BLOCKS
Swing highs and lows are confirmed using the "Swing length" setting. When price closes beyond a swing high, the lowest candle between the swing and the break is marked as a Bullish Order Block. When price closes beyond a swing low, the highest candle before the break is marked as a Bearish Order Block. An Order Block is removed once a candle closes through it.
FAIR VALUE GAPS
A Bullish FVG forms when a candle's low is above the high from two candles earlier; a Bearish FVG is the opposite. Gaps smaller than a set fraction of ATR are ignored to reduce noise. An FVG is removed once price fills it completely.
HOW TO USE IT
The EMA/RSI signal identifies momentum; the Order Blocks and FVGs provide context. For example, a BUY signal forming as price reacts from a Bullish Order Block or Bullish FVG has additional confluence, while a BUY signal running directly into a Bearish Order Block overhead may have limited room to reach its targets. Use the zones to judge the quality of each signal rather than taking every signal mechanically.
SETTINGS
- EMA length, RSI length and RSI level
- SL lookback and SL buffer
- TP step (distance between targets)
- Option to hide same-direction signals while a trade is active
- Zone colors, transparency and fade length
- Candle coloring by trend
- Order Block swing length and maximum count
- FVG minimum size (× ATR) and maximum count
- Option to keep or remove mitigated zones
ALERTS
Alerts are available for Buy, Sell, TP hit and SL hit. For alert messages that include the exact Entry, SL and TP prices, create an alert using "Any alert() function call".
NOTES
- TP levels use a fixed price distance, so the reward-to-risk ratio varies from trade to trade depending on the Stop Loss distance.
- If a single candle touches both the Stop Loss and a Take Profit, the script counts the Stop Loss first, since the order of prices inside one candle cannot be known.
- On instruments other than XAUUSD, adjust the TP step to suit the instrument's price scale.
DISCLAIMER
This indicator is a tool for chart analysis and education. It does not guarantee results and is not financial advice. Always test on historical data and use proper risk management.

Waseem Mohammad
免責聲明
這些資訊和出版物並非旨在提供,也不構成TradingView提供或認可的任何形式的財務、投資、交易或其他類型的建議或推薦。請閱讀使用條款以了解更多資訊。
Waseem Mohammad
免責聲明
這些資訊和出版物並非旨在提供,也不構成TradingView提供或認可的任何形式的財務、投資、交易或其他類型的建議或推薦。請閱讀使用條款以了解更多資訊。