已更新
Minimalist Price Movement Label
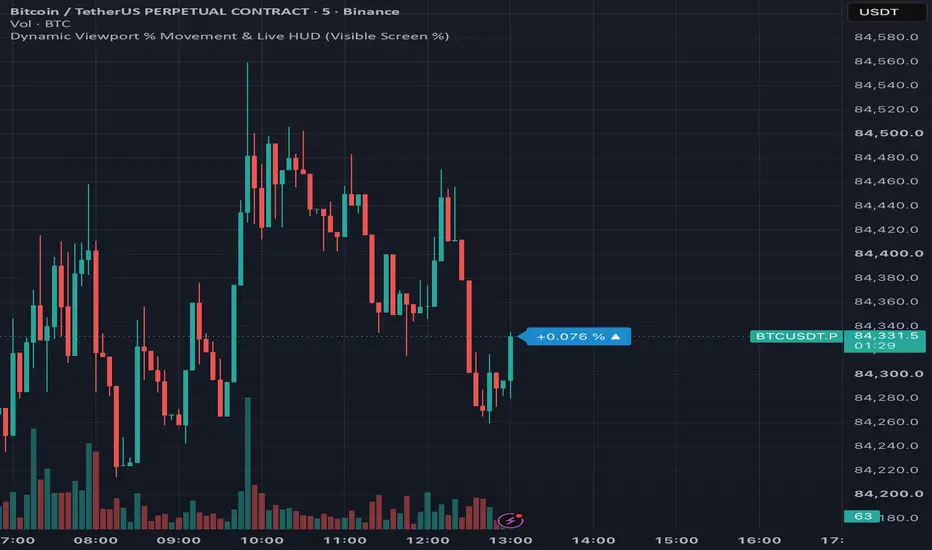
Price Movement Label is an ultra-clean, minimal on-chart HUD designed to display the relative percentage move across your currently visible chart window.
Instead of measuring from a static daily session open or arbitrary fixed period, this script uses TradingView’s chart window variables (chart.left_visible_bar_time to chart.right_visible_bar_time).
As you pan or zoom your chart, the indicator dynamically anchors to the leftmost visible bar's open price and calculates the total percentage change to the latest price in real time. It is particularly useful for order-entry execution, fast visual sizing of screen-level trends, and keeping track of bar timers without cluttering your layout.
Features
How It Works
When the chart renders, the indicator reads the open price of the bar at chart.left_visible_bar_time.On the latest visible bar (chart.right_visible_bar_time), it calculates:
Movement = (Close/Start Price - 1) x 100
The resulting metrics are drawn into a single pinned label styled on the right-hand margin.Note: Because this script relies on visible chart window time boundaries, zooming in, zooming out, or panning left/right will adjust the reference anchor bar to match the new visible range.
發行說明
Dynamic Tick Icon (▲ / ▼): Adds a live micro-indicator directly beside the percentage. Even if your screen is up $+5.4%, you instantly see whether the active candle is pushing higher (▲) or dipping lower (▼) on every price tick.Explicit Sign Indicator: Formats positive moves clearly with a + sign (e.g., +2.450 %) to pair with your purple/blue palette.
Color Mode Selector: Retains original default purple/blue palette linked to Visible Screen %, while letting the users switch to Live Candle or Previous Close with a single dropdown click in the settings menu.
發行說明
Dynamic Viewport % Movement & Live HUD
免責聲明
這些資訊和出版物並非旨在提供,也不構成TradingView提供或認可的任何形式的財務、投資、交易或其他類型的建議或推薦。請閱讀使用條款以了解更多資訊。
免責聲明
這些資訊和出版物並非旨在提供,也不構成TradingView提供或認可的任何形式的財務、投資、交易或其他類型的建議或推薦。請閱讀使用條款以了解更多資訊。