Forex Killzones & Sessions Toolkit [Quanty]
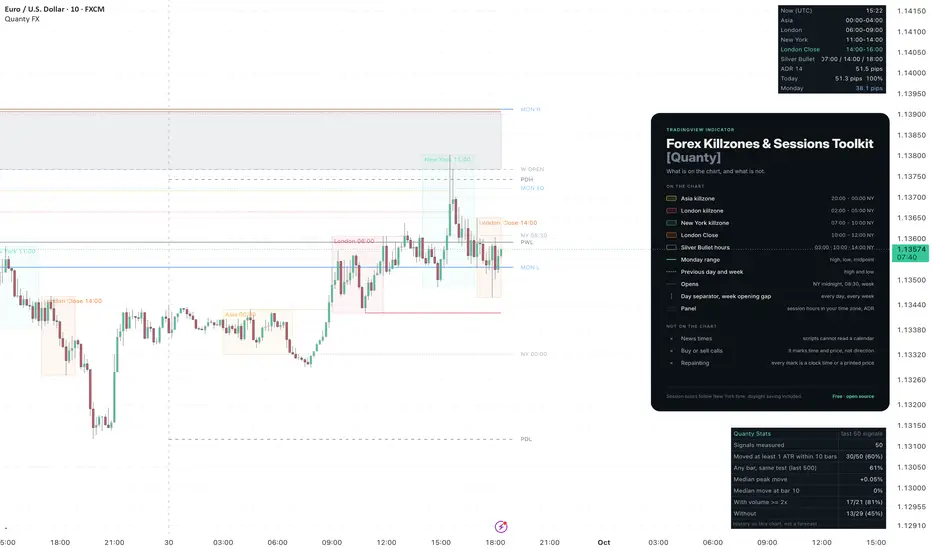
A session map for forex traders. It puts the reference points most intraday forex traders already draw by hand on one chart: the Monday range, the killzones, the session highs and lows that the market tends to come back to, the previous day and week, the opens that matter (New York midnight, 08:30, the week), the ICT Silver Bullet hours and a day separator, with a small panel that shows the session hours in your own time zone.
WHAT IT DRAWS
Monday range: the high, low and midpoint of Monday's daily candle, carried to the end of the week. Monday follows the symbol's own daily candle, which on most forex feeds opens on Sunday at 17:00 New York time.
Killzones: Asia (20:00 to 00:00), London (02:00 to 05:00), New York (07:00 to 10:00) and London Close (10:00 to 12:00), New York time, plus an optional New York PM session. Each is drawn as a box around its own high and low.
Session highs and lows: the Asia and London highs and lows extend to the right until price trades through them, then stop at the candle that took them and turn dotted.
Key levels: previous day and previous week high and low, the New York midnight open, the New York 08:30 open (when most US data is released; charts of 30 minutes and below) and the weekly open, each labelled at the right edge. The new week opening gap (NWOG), between Friday's last close and the week's first open, is carried through the week as a faint box.
Day separator: a thin dashed vertical line where each day starts, so the days read apart at a glance. It follows the symbol's daily candle by default, the same day the previous day high and low use, and can be set to New York midnight instead.
ICT windows: the three Silver Bullet hours (London 03:00-04:00, New York 10:00-11:00 and 14:00-15:00, New York time) drawn as dotted outlines so they read apart from the killzone boxes. Two more can be switched on: the central bank dealers range (CBDR, 14:00-20:00), which prints its size when it closes, and the New York lunch hour (12:00-13:00).
Legend card: an optional key in the corner lists everything drawn, with the session hours in your time zone, and says what the script leaves out: news times and buy or sell calls. It is off by default; switch it on in the Panel settings.
Panel: the time now and each session's hours in the time zone you choose, the average daily range (in pips on forex), how much of it today has used, and the size of the Monday range.
TIME ZONES
Session hours are defined in New York time, and the America/New_York time zone carries daylight saving, so the boxes stay on the right hours all year without any change on your side. The time zone setting changes only how hours are shown, so a trader on UTC+3 sees London as 09:00 to 12:00 in summer and 10:00 to 13:00 after US clocks change. If you prefer, the session hours can be entered in your own time zone instead; they then stay fixed and drift by an hour when US clocks change.
NOTES AND LIMITATIONS
Killzones, ICT windows and the midnight open are drawn on charts of 1 hour and below. Everything drawn is a clock time or a price that already printed; nothing forecasts direction. Economic news times are not included, because scripts cannot read an economic calendar.
ALERTS
Monday high break and Monday low break; Asia, London and New York session high or low taken; London and New York killzone open; Silver Bullet hour open.
HOW TO READ THE STATS TABLE
The table in the corner measures this indicator's own past signals on the chart you are viewing: how many signals fired (the number after the slash), and in how many of them price moved at least 1 ATR (14 bars) in the signal's direction within the next 10 bars. It is a measurement of history on this symbol and timeframe, not a prediction and not a promise. Change the symbol or the timeframe and the numbers change with it. Past results do not guarantee future results.
The row below it runs the same test on every bar of the chart in a random direction, so you can see what a coin toss would have scored here. Two more rows split the count by volume: signals whose candle volume was at least 2 times the average of the previous 50 bars, and the rest. When one side has only a handful of signals, read it as a handful, not as a rate. Pending signals are too recent to be measured and are not counted. The threshold can be set in ATR or in percent, and the number of bars ahead is a setting.
Here a signal is the first close of the day above the previous day's high (upward) or below the previous day's low (downward). Intraday charts only; on daily and higher charts nothing is counted.
WHAT IT DRAWS
Monday range: the high, low and midpoint of Monday's daily candle, carried to the end of the week. Monday follows the symbol's own daily candle, which on most forex feeds opens on Sunday at 17:00 New York time.
Killzones: Asia (20:00 to 00:00), London (02:00 to 05:00), New York (07:00 to 10:00) and London Close (10:00 to 12:00), New York time, plus an optional New York PM session. Each is drawn as a box around its own high and low.
Session highs and lows: the Asia and London highs and lows extend to the right until price trades through them, then stop at the candle that took them and turn dotted.
Key levels: previous day and previous week high and low, the New York midnight open, the New York 08:30 open (when most US data is released; charts of 30 minutes and below) and the weekly open, each labelled at the right edge. The new week opening gap (NWOG), between Friday's last close and the week's first open, is carried through the week as a faint box.
Day separator: a thin dashed vertical line where each day starts, so the days read apart at a glance. It follows the symbol's daily candle by default, the same day the previous day high and low use, and can be set to New York midnight instead.
ICT windows: the three Silver Bullet hours (London 03:00-04:00, New York 10:00-11:00 and 14:00-15:00, New York time) drawn as dotted outlines so they read apart from the killzone boxes. Two more can be switched on: the central bank dealers range (CBDR, 14:00-20:00), which prints its size when it closes, and the New York lunch hour (12:00-13:00).
Legend card: an optional key in the corner lists everything drawn, with the session hours in your time zone, and says what the script leaves out: news times and buy or sell calls. It is off by default; switch it on in the Panel settings.
Panel: the time now and each session's hours in the time zone you choose, the average daily range (in pips on forex), how much of it today has used, and the size of the Monday range.
TIME ZONES
Session hours are defined in New York time, and the America/New_York time zone carries daylight saving, so the boxes stay on the right hours all year without any change on your side. The time zone setting changes only how hours are shown, so a trader on UTC+3 sees London as 09:00 to 12:00 in summer and 10:00 to 13:00 after US clocks change. If you prefer, the session hours can be entered in your own time zone instead; they then stay fixed and drift by an hour when US clocks change.
NOTES AND LIMITATIONS
Killzones, ICT windows and the midnight open are drawn on charts of 1 hour and below. Everything drawn is a clock time or a price that already printed; nothing forecasts direction. Economic news times are not included, because scripts cannot read an economic calendar.
ALERTS
Monday high break and Monday low break; Asia, London and New York session high or low taken; London and New York killzone open; Silver Bullet hour open.
HOW TO READ THE STATS TABLE
The table in the corner measures this indicator's own past signals on the chart you are viewing: how many signals fired (the number after the slash), and in how many of them price moved at least 1 ATR (14 bars) in the signal's direction within the next 10 bars. It is a measurement of history on this symbol and timeframe, not a prediction and not a promise. Change the symbol or the timeframe and the numbers change with it. Past results do not guarantee future results.
The row below it runs the same test on every bar of the chart in a random direction, so you can see what a coin toss would have scored here. Two more rows split the count by volume: signals whose candle volume was at least 2 times the average of the previous 50 bars, and the rest. When one side has only a handful of signals, read it as a handful, not as a rate. Pending signals are too recent to be measured and are not counted. The threshold can be set in ATR or in percent, and the number of bars ahead is a setting.
Here a signal is the first close of the day above the previous day's high (upward) or below the previous day's low (downward). Intraday charts only; on daily and higher charts nothing is counted.

免責聲明
這些資訊和出版物並非旨在提供,也不構成TradingView提供或認可的任何形式的財務、投資、交易或其他類型的建議或推薦。請閱讀使用條款以了解更多資訊。