OPEN-SOURCE SCRIPT
Adaptive Moving Average SD Bands [NJ]
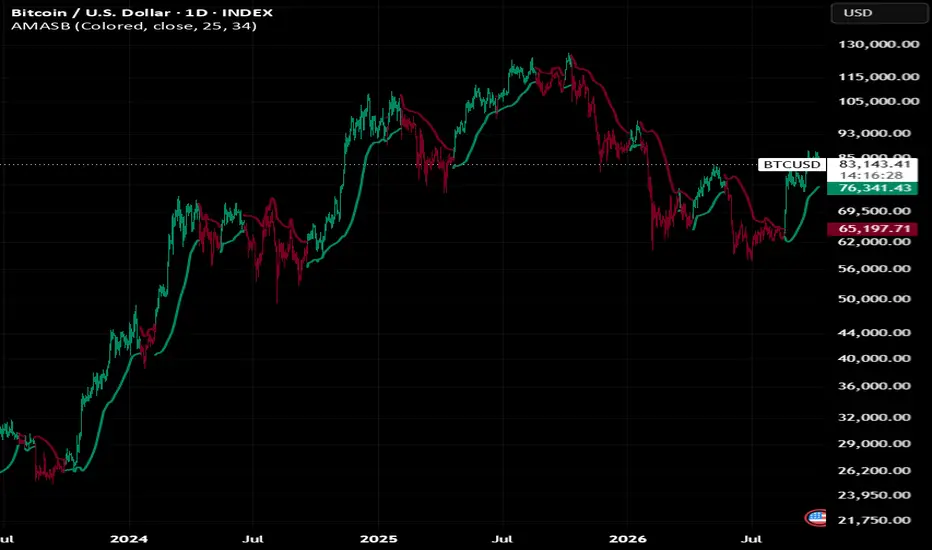
✧ OVERVIEW ✧
Adaptive Moving Average SD Bands is a volatility-based, trend-following indicator that builds standard deviation bands around three different moving averages and combines them into a single outer envelope.
RMA, SWMA and LSMA are calculated from the same source. Each moving average receives its own standard deviation bands, and the highest upper band and lowest lower band are used as the final bands.
Since the three moving averages react to price at different speeds, the envelope adapts its width to the distance between them, requiring a stronger move before the active condition changes.

✧ SETTINGS ✧
Color Mode
Switches between colored and neutral visualization.
Color Candles
Shows or hides candle coloring based on the current signal.
MA Source
Selects the price source used for the moving average calculations.
MA Length
Controls how many bars are used to calculate the RMA and LSMA.
SD Length
Controls how many bars are used to calculate the standard deviation.
✧ HOW IT WORKS ✧
Moving Averages
Indicator calculates three moving averages from selected source:
Wilder's Moving Average (RMA) applies exponential smoothing over MA Length and reacts slowly to new prices.
Symmetrically Weighted Moving Average (SWMA) uses a fixed four-bar window with the highest weights on the two middle bars, so it closely follows recent price.
Least Squares Moving Average (LSMA) fits a linear regression line over MA Length with a fixed offset of 1.
Standard Deviation Bands
Standard deviation of closing price is calculated over SD Length and measures how widely price has recently been dispersed.
Each moving average receives its own pair of bands:
Upper Band = Moving Average + Standard Deviation
Lower Band = Moving Average − Standard Deviation
Outer Envelope
Highest of the three upper bands is used as final upper band. Lowest of the three lower bands is used as final lower band.
When the moving averages spread apart, the envelope widens. When they converge, the envelope narrows toward a single pair of bands.
Signal Logic
A bullish condition is activated when the high of a candle moves above the final upper band.
A bearish condition is activated when the low of a candle moves below the final lower band.
If both happen on the same candle, the bearish condition takes priority.
Active condition remains unchanged until the opposite condition occurs.
✧ VISUALIZATION ✧
Green represents a bullish condition.
Red represents a bearish condition.
Neutral mode displays the same conditions using light and dark shades.
During a bullish condition, lower band is displayed in green.
During a bearish condition, upper band is displayed in red.
Same signal colors can optionally be applied directly to the chart candles.
✧ USAGE ✧
Adaptive Moving Average SD Bands can be used to identify:
Bullish and bearish trend conditions
Volatility-adjusted price breakouts
Dynamic trend support and resistance
Directional market bias
Trend confirmation
Additional confirmation for other technical analysis
Combining a slow, a fast and a regression-based moving average is designed to filter minor price moves that would cross bands built around a single moving average.
As with any technical indicator, it is best used alongside other forms of analysis rather than as a standalone entry or exit signal.
Adaptive Moving Average SD Bands is a volatility-based, trend-following indicator that builds standard deviation bands around three different moving averages and combines them into a single outer envelope.
RMA, SWMA and LSMA are calculated from the same source. Each moving average receives its own standard deviation bands, and the highest upper band and lowest lower band are used as the final bands.
Since the three moving averages react to price at different speeds, the envelope adapts its width to the distance between them, requiring a stronger move before the active condition changes.
✧ SETTINGS ✧
Color Mode
Switches between colored and neutral visualization.
Color Candles
Shows or hides candle coloring based on the current signal.
MA Source
Selects the price source used for the moving average calculations.
MA Length
Controls how many bars are used to calculate the RMA and LSMA.
SD Length
Controls how many bars are used to calculate the standard deviation.
✧ HOW IT WORKS ✧
Moving Averages
Indicator calculates three moving averages from selected source:
Wilder's Moving Average (RMA) applies exponential smoothing over MA Length and reacts slowly to new prices.
Symmetrically Weighted Moving Average (SWMA) uses a fixed four-bar window with the highest weights on the two middle bars, so it closely follows recent price.
Least Squares Moving Average (LSMA) fits a linear regression line over MA Length with a fixed offset of 1.
Standard Deviation Bands
Standard deviation of closing price is calculated over SD Length and measures how widely price has recently been dispersed.
Each moving average receives its own pair of bands:
Upper Band = Moving Average + Standard Deviation
Lower Band = Moving Average − Standard Deviation
Outer Envelope
Highest of the three upper bands is used as final upper band. Lowest of the three lower bands is used as final lower band.
When the moving averages spread apart, the envelope widens. When they converge, the envelope narrows toward a single pair of bands.
Signal Logic
A bullish condition is activated when the high of a candle moves above the final upper band.
A bearish condition is activated when the low of a candle moves below the final lower band.
If both happen on the same candle, the bearish condition takes priority.
Active condition remains unchanged until the opposite condition occurs.
✧ VISUALIZATION ✧
Green represents a bullish condition.
Red represents a bearish condition.
Neutral mode displays the same conditions using light and dark shades.
During a bullish condition, lower band is displayed in green.
During a bearish condition, upper band is displayed in red.
Same signal colors can optionally be applied directly to the chart candles.
✧ USAGE ✧
Adaptive Moving Average SD Bands can be used to identify:
Bullish and bearish trend conditions
Volatility-adjusted price breakouts
Dynamic trend support and resistance
Directional market bias
Trend confirmation
Additional confirmation for other technical analysis
Combining a slow, a fast and a regression-based moving average is designed to filter minor price moves that would cross bands built around a single moving average.
As with any technical indicator, it is best used alongside other forms of analysis rather than as a standalone entry or exit signal.
開源腳本
秉持TradingView一貫精神,這個腳本的創作者將其設為開源,以便交易者檢視並驗證其功能。向作者致敬!您可以免費使用此腳本,但請注意,重新發佈代碼需遵守我們的社群規範。

免責聲明
這些資訊和出版物並非旨在提供,也不構成TradingView提供或認可的任何形式的財務、投資、交易或其他類型的建議或推薦。請閱讀使用條款以了解更多資訊。
開源腳本
秉持TradingView一貫精神,這個腳本的創作者將其設為開源,以便交易者檢視並驗證其功能。向作者致敬!您可以免費使用此腳本,但請注意,重新發佈代碼需遵守我們的社群規範。
免責聲明
這些資訊和出版物並非旨在提供,也不構成TradingView提供或認可的任何形式的財務、投資、交易或其他類型的建議或推薦。請閱讀使用條款以了解更多資訊。