OPEN-SOURCE SCRIPT
Long-Term Growth Stock Scorer
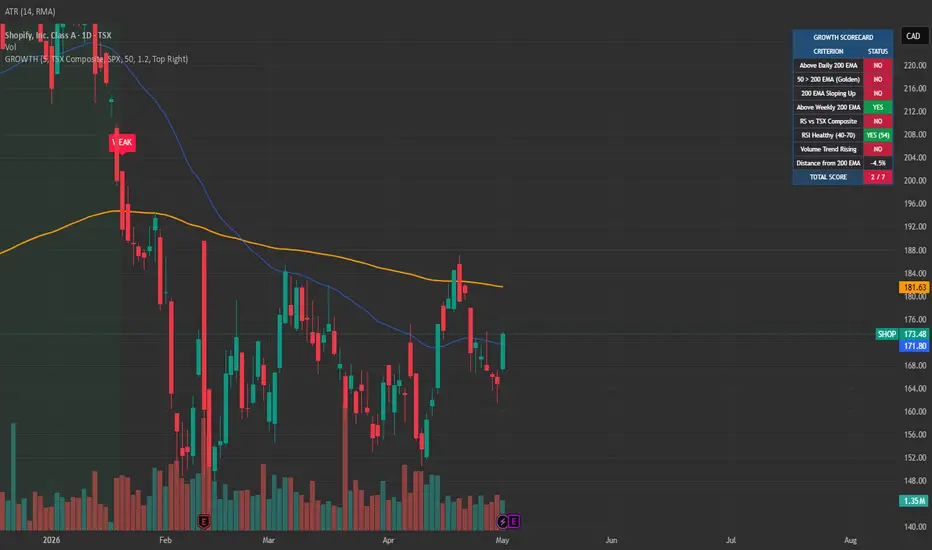
Long-Term Growth Stock Scorer plots a 7-criterion scoring system on any stock, identifying high-quality growth setups and signaling 200 EMA retest entries. Designed for long-term investors building positions in trending stocks with confirmed strength across trend, momentum, and participation.
THE 7-CRITERION SCORECARD
Each stock is scored 0-7 based on:
Price above daily 200 EMA — primary trend
50 EMA above 200 EMA — golden cross alignment
200 EMA sloping up — confirmed long-term uptrend
Price above weekly 200 EMA — multi-timeframe confirmation
Relative strength vs benchmark (S&P 500, NASDAQ 100, TSX Composite, FTSE, ASX, Russell 2000, or any custom symbol)
RSI in healthy range (40-70) — momentum quality, not exhausted
Volume trend rising — institutional participation expanding
SIGNALS
BUY label fires when a qualified stock (score >= threshold) retests its 200 EMA on volume
WEAK label fires when a held position drops below the qualification threshold
Background highlight when current score is in the qualified zone
Three built-in alerts: buy signal, score weakening, and score strengthening (entering the qualified zone)
FEATURES
Configurable benchmark index — works for any major market or custom symbol
Live dashboard showing each criterion's pass/fail status, current RSI value, and distance from 200 EMA
Six dashboard position options
Adjustable minimum score threshold (default 5/7)
Volume confirmation toggle for retest signals
HOW TO USE
Run on any stock chart on the daily timeframe. Set your benchmark to match the stock's market (S&P 500 for US stocks, TSX Composite for Canadian stocks, etc.). Use the dashboard to scan watchlist stocks for current qualification. When a qualified stock retests its 200 EMA on rising volume, the BUY signal fires.
Best used as a confirmation layer alongside fundamental analysis — strong technical setups need strong businesses underneath.
Open-source. Feedback and forks welcome.
THE 7-CRITERION SCORECARD
Each stock is scored 0-7 based on:
Price above daily 200 EMA — primary trend
50 EMA above 200 EMA — golden cross alignment
200 EMA sloping up — confirmed long-term uptrend
Price above weekly 200 EMA — multi-timeframe confirmation
Relative strength vs benchmark (S&P 500, NASDAQ 100, TSX Composite, FTSE, ASX, Russell 2000, or any custom symbol)
RSI in healthy range (40-70) — momentum quality, not exhausted
Volume trend rising — institutional participation expanding
SIGNALS
BUY label fires when a qualified stock (score >= threshold) retests its 200 EMA on volume
WEAK label fires when a held position drops below the qualification threshold
Background highlight when current score is in the qualified zone
Three built-in alerts: buy signal, score weakening, and score strengthening (entering the qualified zone)
FEATURES
Configurable benchmark index — works for any major market or custom symbol
Live dashboard showing each criterion's pass/fail status, current RSI value, and distance from 200 EMA
Six dashboard position options
Adjustable minimum score threshold (default 5/7)
Volume confirmation toggle for retest signals
HOW TO USE
Run on any stock chart on the daily timeframe. Set your benchmark to match the stock's market (S&P 500 for US stocks, TSX Composite for Canadian stocks, etc.). Use the dashboard to scan watchlist stocks for current qualification. When a qualified stock retests its 200 EMA on rising volume, the BUY signal fires.
Best used as a confirmation layer alongside fundamental analysis — strong technical setups need strong businesses underneath.
Open-source. Feedback and forks welcome.
開源腳本
秉持TradingView一貫精神,這個腳本的創作者將其設為開源,以便交易者檢視並驗證其功能。向作者致敬!您可以免費使用此腳本,但請注意,重新發佈代碼需遵守我們的社群規範。

免責聲明
這些資訊和出版物並非旨在提供,也不構成TradingView提供或認可的任何形式的財務、投資、交易或其他類型的建議或推薦。請閱讀使用條款以了解更多資訊。
免責聲明
這些資訊和出版物並非旨在提供,也不構成TradingView提供或認可的任何形式的財務、投資、交易或其他類型的建議或推薦。請閱讀使用條款以了解更多資訊。