已更新
P2F - Pre-Market High and Low
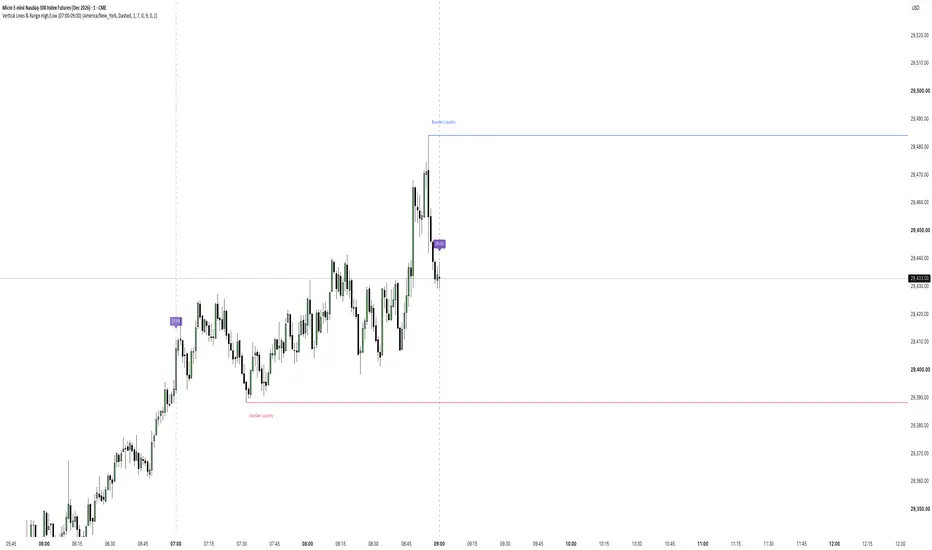
An ICT/SMC-style indicator that marks a specific time window on an intraday chart (default 07:00–09:00 New York time, fully configurable) and tracks three things within that range:
1. Time Markers
Two vertical lines mark the start and end of the range (e.g. 07:00 and 09:00), each with a time label. Both lines are drawn together as soon as the range begins, so traders can see the full session box right away instead of waiting for real time to actually reach the end time.
2. Range High/Low — Buyside & Sellside Liquidity
While the range is forming, the indicator tracks the running high and low live and plots them as two horizontal lines (Buyside Liquidity above, Sellside Liquidity below) that move with price in real time. Once the range closes, both lines lock to their final level and automatically extend to the right until that level gets swept by price — representing untouched liquidity left behind by the session. Any unswept level from the previous session is also automatically frozen once a new range starts, so lines don't pile up extending indefinitely across days.
3. Fair Value Gap (FVG) / Inversion FVG (IFVG)
Detects standard 3-candle bullish and bearish Fair Value Gaps, but only for gaps formed inside the range's time window. An unfilled gap is drawn as a box labeled "FVG" and keeps extending to the right; once price fully closes the gap, the box stops extending and its label switches to "IFVG". Only the single most recent bullish and most recent bearish FVG/IFVG are shown at any time — a new one replaces the older one on its side, keeping the chart clean.
Configurable inputs: timezone, range start/end hour & minute, line style/color, Buyside/Sellside Liquidity colors, and bullish/bearish FVG box colors.
---
1. Time Markers
Two vertical lines mark the start and end of the range (e.g. 07:00 and 09:00), each with a time label. Both lines are drawn together as soon as the range begins, so traders can see the full session box right away instead of waiting for real time to actually reach the end time.
2. Range High/Low — Buyside & Sellside Liquidity
While the range is forming, the indicator tracks the running high and low live and plots them as two horizontal lines (Buyside Liquidity above, Sellside Liquidity below) that move with price in real time. Once the range closes, both lines lock to their final level and automatically extend to the right until that level gets swept by price — representing untouched liquidity left behind by the session. Any unswept level from the previous session is also automatically frozen once a new range starts, so lines don't pile up extending indefinitely across days.
3. Fair Value Gap (FVG) / Inversion FVG (IFVG)
Detects standard 3-candle bullish and bearish Fair Value Gaps, but only for gaps formed inside the range's time window. An unfilled gap is drawn as a box labeled "FVG" and keeps extending to the right; once price fully closes the gap, the box stops extending and its label switches to "IFVG". Only the single most recent bullish and most recent bearish FVG/IFVG are shown at any time — a new one replaces the older one on its side, keeping the chart clean.
Configurable inputs: timezone, range start/end hour & minute, line style/color, Buyside/Sellside Liquidity colors, and bullish/bearish FVG box colors.
---
發行說明
Changes only for fixing after candle outside the range
免責聲明
這些資訊和出版物並非旨在提供,也不構成TradingView提供或認可的任何形式的財務、投資、交易或其他類型的建議或推薦。請閱讀使用條款以了解更多資訊。
免責聲明
這些資訊和出版物並非旨在提供,也不構成TradingView提供或認可的任何形式的財務、投資、交易或其他類型的建議或推薦。請閱讀使用條款以了解更多資訊。