已更新
TradeBee Opening Range Liquidity Mean Reversal Scalping
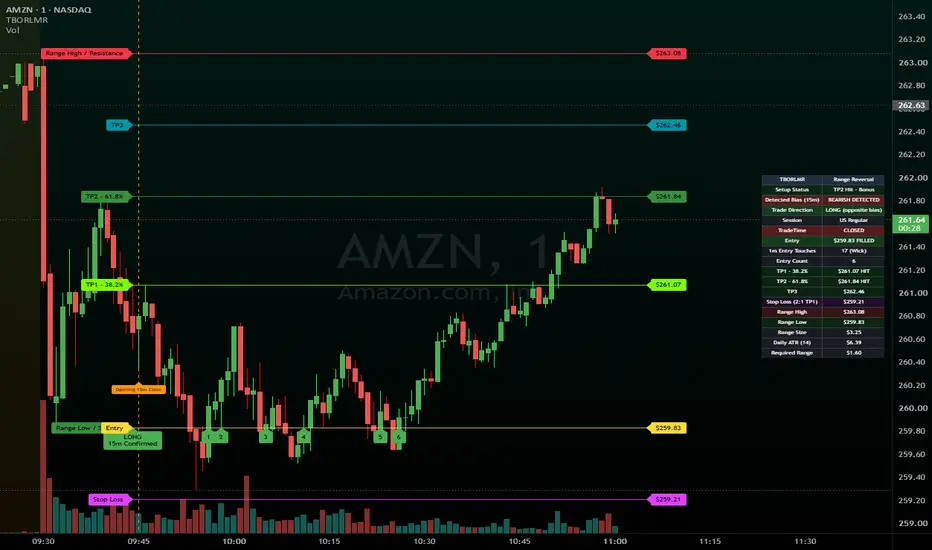
# TradeBee Opening Range Liquidity Mean Reversal (TBORLMR)
## Overview
**TradeBee Opening Range Liquidity Mean Reversal (TBORLMR) SCALP** is an intraday indicator designed to identify potential mean-reversion opportunities around the first 15-minute candle of a selected trading session and then SCALP at 1minute TF(Particularly designed for Large/Mega Caps, ETFs).
The concept is straightforward: the first 15-minute candle establishes an opening range. When that candle meets the minimum range-size requirement, the indicator looks for a potential reversal trade at the opposite extreme of the opening candle.
TBORLMR is designed to provide a structured framework for evaluating a setup—not to generate a trade on every session. It displays potential entry levels, Fibonacci-based profit targets, a calculated stop-loss level, price-level guides, and a dashboard for monitoring the setup.
**The objective is selectivity, not trading frequency. You do not have to take every setup. No trade is often the best decision when the criteria are not satisfied.**
---
## 1. How the indicator works
### Step 1 — Identify the opening range
The indicator uses the first fully closed 15-minute candle of the selected session.
It identifies:
- Opening Range High
- Opening Range Low
- Opening Range Size
- The opening candle's bullish, bearish, or doji bias
- The previous completed daily ATR used to evaluate the range size
The opening range is not considered final until the 15-minute candle closes.
### Step 2 — Apply the minimum range filter
The opening candle must meet the configured minimum range size as a percentage of the previous completed daily ATR.
For example, with the default minimum of 25%, the opening candle's high-to-low range must be at least 25% of the daily ATR.
If the candle does not meet the requirement, the setup is rejected. A doji also does not qualify.
This filter is intended to avoid trading opening ranges that are too small relative to the instrument's recent daily volatility.
### Step 3 — Determine the potential reversal direction
The indicator evaluates the opening candle and defines the potential trade direction as follows:
- **Bearish opening candle → Potential LONG:** Entry is placed at the Opening Range Low.
- **Bullish opening candle → Potential SHORT:** Entry is placed at the Opening Range High.
- **Doji or insufficient range → No valid setup.**
This is a reversal framework, not a breakout strategy. The opening candle's direction determines which opposite boundary is monitored for a potential entry.
### Step 4 — Wait for price to reach the entry level
The indicator monitors price against the designated entry level. The setup can remain active until the selected regular session ends if the entry has not been reached.
The recommended operating chart is **1 minute**, because entry touches and trade progress are monitored using 1-minute candles.
The entry-touch method can be configured:
- **Wick:** The candle's high-low range intersects the entry price.
- **Body:** The candle's open-close body intersects the entry price.
The touch counter records qualifying 1-minute candle intersections, including consecutive candles. A touch count is not a probability score and does not guarantee a reversal.
### Step 5 — Manage the trade using targets and stop loss
The indicator calculates the following levels from the opening range:
**TP1 — 38.2% retracement**
The first Fibonacci retracement level inside the opening range, measured from the entry-side boundary.
**TP2 — 61.8% retracement**
The second Fibonacci retracement level inside the opening range.
**TP3 — midpoint between TP2 and the opposite opening-range boundary**
TP3 provides an additional target for a trade that progresses beyond TP2.
**Stop loss — 2:1 reward-to-risk reference based on TP1**
The stop is calculated so that the distance from entry to TP1 is twice the entry-to-stop distance, assuming the configured entry is the actual fill price.
For a LONG, the stop is below the entry. For a SHORT, it is above the entry.
These are calculated reference levels. Actual fills, slippage, commissions, gaps, and execution conditions can change the realized reward-to-risk ratio.
The indicator monitors the trade as targets or the stop are reached. If the stop and a target are both touched in the same 1-minute candle, the indicator applies a conservative stop-first assumption because candle data alone cannot establish which level was reached first.
---
## 2. Strict entry criteria — do not force a trade
TBORLMR should be used as a **selective setup filter**, not as a signal to trade every day.
Before considering an entry, verify all of the following:
1. The selected session is correct for the instrument being traded.
2. The first 15-minute session candle has fully closed.
3. The candle's range meets the configured minimum percentage of daily ATR.
4. The opening candle is not a doji.
5. The indicator displays a valid LONG or SHORT setup.
6. Price reaches the correct entry boundary during the permitted session.
7. The trade offers acceptable reward-to-risk after accounting for costs and likely execution conditions.
8. The broader market context, liquidity, volatility, and any scheduled news do not make the trade inappropriate.
9. You can define your risk before entering and are comfortable with the potential loss.
**If any essential criterion is missing, skip the trade.**
Do not enter simply because a line is visible, because the touch count is increasing, or because the market has moved a long distance. Do not chase a missed entry or treat an expired setup as an active signal.
The indicator does not establish that a reversal will occur. It identifies a predefined opportunity for further evaluation.
### A disciplined trading workflow
1. Select the correct session and configure the indicator.
2. Wait for the first 15-minute candle to close.
3. Check whether the range-size filter is satisfied.
4. Confirm the detected bias, trade direction, and entry level.
5. Wait for price to reach the entry level; do not anticipate the touch.
6. Evaluate the market context and determine position size from your predefined risk limit.
7. Use TP1, TP2, TP3, and the stop-loss reference as part of your trade plan.
8. Stop considering the setup when it expires or reaches its terminal condition.
A valid indicator setup is not automatically a valid trade for your account or risk tolerance.
---
## 3. Dashboard guide
The dashboard summarizes the active session and setup.
- **Setup Status:** Indicates whether the indicator is waiting for a valid setup, waiting for entry, monitoring a filled entry, has reached a target or stop, or has expired.
- **Detected Bias (15m):** Shows whether the opening candle was bullish, bearish, or neutral/doji.
- **Trade Direction:** Displays the potential LONG or SHORT direction derived from the opening candle.
- **Session:** Shows the selected trading session.
- **Entry:** The designated opening-range boundary to monitor.
- **Touches:** The number of qualifying 1-minute candles that have intersected the entry level.
- **TP1:** The 38.2% retracement target.
- **TP2:** The 61.8% retracement target.
- **TP3:** The additional target halfway between TP2 and the opposite opening-range boundary.
- **Stop Loss:** The calculated stop reference based on the TP1 reward-to-risk relationship.
- **Range High:** The opening candle's high.
- **Range Low:** The opening candle's low.
- **Range Size:** The high-to-low size of the opening candle.
- **Daily ATR:** The previous completed daily ATR used by the range filter.
- **Required Range:** The minimum opening range required by the configured ATR percentage.
Individual dashboard rows can be enabled or disabled in the configuration panel.
---
## 4. Configuration panel
Names and availability of individual controls may vary slightly by script version.
### A. Session settings
**Session Preset**
Choose the session whose opening candle the indicator should evaluate:
- US Regular
- Europe
- Asia
- India
- Custom
**Custom Session Hours**
Defines the session hours when Custom is selected. Configure these for the instrument and market you are trading.
**Custom Session Time Zone**
Specifies the time zone used by the custom session. Verify the session boundaries and daylight-saving behavior before trading.
**Important:** Selecting the wrong session or time zone can produce the wrong opening range.
### B. Setup and volatility filter
**Daily ATR Length**
Controls the number of daily bars used to calculate ATR. The default is 14.
**Minimum Range (% of Daily ATR)**
Sets the minimum opening-candle range relative to the previous completed daily ATR. The default is 25%.
Increasing this threshold makes the range filter more selective. Decreasing it permits smaller opening ranges and may allow more setups.
A lower threshold is not necessarily better. Choose a value based on testing and the behavior of the instrument.
### C. Entry monitoring
**Entry Touch Method**
- Wick: counts a candle when its high-low range intersects the entry price.
- Body: counts a candle when its open-close body intersects the entry price.
Use the method that matches your trading rules. Neither method guarantees a fill at the displayed entry price.
### D. Level display
**Show TP1, TP2, and TP3**
Independently controls whether the corresponding target lines are displayed.
**TP3 Color**
Controls the TP3 line color. The preferred color is teal, `#0097A7`.
**Level Colors**
Controls the visual colors of the displayed price levels, allowing the chart to distinguish targets, range boundaries, and other references.
**Line Width**
Controls the thickness of the level lines. The default is 1.
**Line Style**
Choose Solid, Dashed, or Dotted.
**Level Labels**
Controls the display of level names and associated price labels.
**Label Size**
Controls the size of the displayed labels.
**Label Text Colors**
Allows the text colors of the labels to be configured independently of the level lines.
**Extra Line Extension Bars**
Controls how far the level lines extend beyond the latest bar. The lines dynamically extend as new bars appear.
### E. Confirmation labels
**Show Confirmation Labels**
Controls whether the indicator displays confirmation or status labels on the chart.
**Confirmation Label Text Colors**
Controls the text colors used by these labels independently of the dashboard's color settings.
### F. Dashboard settings
**Show Dashboard**
Controls the dashboard display, if provided by the script version.
**Dashboard Position**
Selects where the dashboard appears on the chart. The default position is Middle Right.
**Dashboard Colors**
Controls the visual treatment of bullish, bearish, and neutral bias and status-related rows. These colors are for readability, not a measure of trade quality.
**Individual Row Toggles**
Allows you to show or hide individual rows, including status, bias, direction, session, entry, touches, TP1, TP2, TP3, stop loss, range high, range low, range size, daily ATR, and required range.
Hiding a row changes the dashboard display, not the underlying setup calculation.
---
## 5. Recommended chart and usage
- Use a **1-minute chart** for entry-touch and trade monitoring.
- Allow the first 15-minute session candle to close before evaluating the setup.
- Confirm the session preset and time zone.
- Start with the default ATR length and minimum range threshold, then test changes on the instruments and sessions you actually trade.
- Review historical examples, including failed reversals, missed entries, stop-outs, and sessions with no valid setup.
- Use realistic costs and execution assumptions when evaluating performance.
TBORLMR is an indicator, not an automated trading strategy. It does not submit orders, guarantee execution, or determine a suitable position size for you.
---
## 6. Risk management and disclaimer
This script is provided for educational and informational purposes only. It is not financial, investment, or trading advice and is not a recommendation to buy or sell any security, futures contract, currency, cryptocurrency, or other financial instrument.
Trading involves substantial risk and can result in the loss of some or all of your capital. Past performance, historical chart behavior, and indicator signals do not guarantee future results. No indicator or setup can guarantee profitability.
The levels displayed by TBORLMR are calculated references, not guaranteed execution prices. Slippage, commissions, spreads, liquidity, gaps, volatility, and broker or exchange execution rules can materially affect outcomes. Intrabar price ordering cannot always be determined from OHLC candle data; the indicator's stop-first assumption when a stop and target are touched in the same candle is a conservative modeling convention, not a reconstruction of actual trade execution.
Always conduct your own research and testing, apply appropriate risk management, and consult a qualified financial professional if needed. Never risk money you cannot afford to lose.
**Trade selectively. Respect the criteria. Protect capital first. Skipping a trade is a valid decision.**
## Overview
**TradeBee Opening Range Liquidity Mean Reversal (TBORLMR) SCALP** is an intraday indicator designed to identify potential mean-reversion opportunities around the first 15-minute candle of a selected trading session and then SCALP at 1minute TF(Particularly designed for Large/Mega Caps, ETFs).
The concept is straightforward: the first 15-minute candle establishes an opening range. When that candle meets the minimum range-size requirement, the indicator looks for a potential reversal trade at the opposite extreme of the opening candle.
TBORLMR is designed to provide a structured framework for evaluating a setup—not to generate a trade on every session. It displays potential entry levels, Fibonacci-based profit targets, a calculated stop-loss level, price-level guides, and a dashboard for monitoring the setup.
**The objective is selectivity, not trading frequency. You do not have to take every setup. No trade is often the best decision when the criteria are not satisfied.**
---
## 1. How the indicator works
### Step 1 — Identify the opening range
The indicator uses the first fully closed 15-minute candle of the selected session.
It identifies:
- Opening Range High
- Opening Range Low
- Opening Range Size
- The opening candle's bullish, bearish, or doji bias
- The previous completed daily ATR used to evaluate the range size
The opening range is not considered final until the 15-minute candle closes.
### Step 2 — Apply the minimum range filter
The opening candle must meet the configured minimum range size as a percentage of the previous completed daily ATR.
For example, with the default minimum of 25%, the opening candle's high-to-low range must be at least 25% of the daily ATR.
If the candle does not meet the requirement, the setup is rejected. A doji also does not qualify.
This filter is intended to avoid trading opening ranges that are too small relative to the instrument's recent daily volatility.
### Step 3 — Determine the potential reversal direction
The indicator evaluates the opening candle and defines the potential trade direction as follows:
- **Bearish opening candle → Potential LONG:** Entry is placed at the Opening Range Low.
- **Bullish opening candle → Potential SHORT:** Entry is placed at the Opening Range High.
- **Doji or insufficient range → No valid setup.**
This is a reversal framework, not a breakout strategy. The opening candle's direction determines which opposite boundary is monitored for a potential entry.
### Step 4 — Wait for price to reach the entry level
The indicator monitors price against the designated entry level. The setup can remain active until the selected regular session ends if the entry has not been reached.
The recommended operating chart is **1 minute**, because entry touches and trade progress are monitored using 1-minute candles.
The entry-touch method can be configured:
- **Wick:** The candle's high-low range intersects the entry price.
- **Body:** The candle's open-close body intersects the entry price.
The touch counter records qualifying 1-minute candle intersections, including consecutive candles. A touch count is not a probability score and does not guarantee a reversal.
### Step 5 — Manage the trade using targets and stop loss
The indicator calculates the following levels from the opening range:
**TP1 — 38.2% retracement**
The first Fibonacci retracement level inside the opening range, measured from the entry-side boundary.
**TP2 — 61.8% retracement**
The second Fibonacci retracement level inside the opening range.
**TP3 — midpoint between TP2 and the opposite opening-range boundary**
TP3 provides an additional target for a trade that progresses beyond TP2.
**Stop loss — 2:1 reward-to-risk reference based on TP1**
The stop is calculated so that the distance from entry to TP1 is twice the entry-to-stop distance, assuming the configured entry is the actual fill price.
For a LONG, the stop is below the entry. For a SHORT, it is above the entry.
These are calculated reference levels. Actual fills, slippage, commissions, gaps, and execution conditions can change the realized reward-to-risk ratio.
The indicator monitors the trade as targets or the stop are reached. If the stop and a target are both touched in the same 1-minute candle, the indicator applies a conservative stop-first assumption because candle data alone cannot establish which level was reached first.
---
## 2. Strict entry criteria — do not force a trade
TBORLMR should be used as a **selective setup filter**, not as a signal to trade every day.
Before considering an entry, verify all of the following:
1. The selected session is correct for the instrument being traded.
2. The first 15-minute session candle has fully closed.
3. The candle's range meets the configured minimum percentage of daily ATR.
4. The opening candle is not a doji.
5. The indicator displays a valid LONG or SHORT setup.
6. Price reaches the correct entry boundary during the permitted session.
7. The trade offers acceptable reward-to-risk after accounting for costs and likely execution conditions.
8. The broader market context, liquidity, volatility, and any scheduled news do not make the trade inappropriate.
9. You can define your risk before entering and are comfortable with the potential loss.
**If any essential criterion is missing, skip the trade.**
Do not enter simply because a line is visible, because the touch count is increasing, or because the market has moved a long distance. Do not chase a missed entry or treat an expired setup as an active signal.
The indicator does not establish that a reversal will occur. It identifies a predefined opportunity for further evaluation.
### A disciplined trading workflow
1. Select the correct session and configure the indicator.
2. Wait for the first 15-minute candle to close.
3. Check whether the range-size filter is satisfied.
4. Confirm the detected bias, trade direction, and entry level.
5. Wait for price to reach the entry level; do not anticipate the touch.
6. Evaluate the market context and determine position size from your predefined risk limit.
7. Use TP1, TP2, TP3, and the stop-loss reference as part of your trade plan.
8. Stop considering the setup when it expires or reaches its terminal condition.
A valid indicator setup is not automatically a valid trade for your account or risk tolerance.
---
## 3. Dashboard guide
The dashboard summarizes the active session and setup.
- **Setup Status:** Indicates whether the indicator is waiting for a valid setup, waiting for entry, monitoring a filled entry, has reached a target or stop, or has expired.
- **Detected Bias (15m):** Shows whether the opening candle was bullish, bearish, or neutral/doji.
- **Trade Direction:** Displays the potential LONG or SHORT direction derived from the opening candle.
- **Session:** Shows the selected trading session.
- **Entry:** The designated opening-range boundary to monitor.
- **Touches:** The number of qualifying 1-minute candles that have intersected the entry level.
- **TP1:** The 38.2% retracement target.
- **TP2:** The 61.8% retracement target.
- **TP3:** The additional target halfway between TP2 and the opposite opening-range boundary.
- **Stop Loss:** The calculated stop reference based on the TP1 reward-to-risk relationship.
- **Range High:** The opening candle's high.
- **Range Low:** The opening candle's low.
- **Range Size:** The high-to-low size of the opening candle.
- **Daily ATR:** The previous completed daily ATR used by the range filter.
- **Required Range:** The minimum opening range required by the configured ATR percentage.
Individual dashboard rows can be enabled or disabled in the configuration panel.
---
## 4. Configuration panel
Names and availability of individual controls may vary slightly by script version.
### A. Session settings
**Session Preset**
Choose the session whose opening candle the indicator should evaluate:
- US Regular
- Europe
- Asia
- India
- Custom
**Custom Session Hours**
Defines the session hours when Custom is selected. Configure these for the instrument and market you are trading.
**Custom Session Time Zone**
Specifies the time zone used by the custom session. Verify the session boundaries and daylight-saving behavior before trading.
**Important:** Selecting the wrong session or time zone can produce the wrong opening range.
### B. Setup and volatility filter
**Daily ATR Length**
Controls the number of daily bars used to calculate ATR. The default is 14.
**Minimum Range (% of Daily ATR)**
Sets the minimum opening-candle range relative to the previous completed daily ATR. The default is 25%.
Increasing this threshold makes the range filter more selective. Decreasing it permits smaller opening ranges and may allow more setups.
A lower threshold is not necessarily better. Choose a value based on testing and the behavior of the instrument.
### C. Entry monitoring
**Entry Touch Method**
- Wick: counts a candle when its high-low range intersects the entry price.
- Body: counts a candle when its open-close body intersects the entry price.
Use the method that matches your trading rules. Neither method guarantees a fill at the displayed entry price.
### D. Level display
**Show TP1, TP2, and TP3**
Independently controls whether the corresponding target lines are displayed.
**TP3 Color**
Controls the TP3 line color. The preferred color is teal, `#0097A7`.
**Level Colors**
Controls the visual colors of the displayed price levels, allowing the chart to distinguish targets, range boundaries, and other references.
**Line Width**
Controls the thickness of the level lines. The default is 1.
**Line Style**
Choose Solid, Dashed, or Dotted.
**Level Labels**
Controls the display of level names and associated price labels.
**Label Size**
Controls the size of the displayed labels.
**Label Text Colors**
Allows the text colors of the labels to be configured independently of the level lines.
**Extra Line Extension Bars**
Controls how far the level lines extend beyond the latest bar. The lines dynamically extend as new bars appear.
### E. Confirmation labels
**Show Confirmation Labels**
Controls whether the indicator displays confirmation or status labels on the chart.
**Confirmation Label Text Colors**
Controls the text colors used by these labels independently of the dashboard's color settings.
### F. Dashboard settings
**Show Dashboard**
Controls the dashboard display, if provided by the script version.
**Dashboard Position**
Selects where the dashboard appears on the chart. The default position is Middle Right.
**Dashboard Colors**
Controls the visual treatment of bullish, bearish, and neutral bias and status-related rows. These colors are for readability, not a measure of trade quality.
**Individual Row Toggles**
Allows you to show or hide individual rows, including status, bias, direction, session, entry, touches, TP1, TP2, TP3, stop loss, range high, range low, range size, daily ATR, and required range.
Hiding a row changes the dashboard display, not the underlying setup calculation.
---
## 5. Recommended chart and usage
- Use a **1-minute chart** for entry-touch and trade monitoring.
- Allow the first 15-minute session candle to close before evaluating the setup.
- Confirm the session preset and time zone.
- Start with the default ATR length and minimum range threshold, then test changes on the instruments and sessions you actually trade.
- Review historical examples, including failed reversals, missed entries, stop-outs, and sessions with no valid setup.
- Use realistic costs and execution assumptions when evaluating performance.
TBORLMR is an indicator, not an automated trading strategy. It does not submit orders, guarantee execution, or determine a suitable position size for you.
---
## 6. Risk management and disclaimer
This script is provided for educational and informational purposes only. It is not financial, investment, or trading advice and is not a recommendation to buy or sell any security, futures contract, currency, cryptocurrency, or other financial instrument.
Trading involves substantial risk and can result in the loss of some or all of your capital. Past performance, historical chart behavior, and indicator signals do not guarantee future results. No indicator or setup can guarantee profitability.
The levels displayed by TBORLMR are calculated references, not guaranteed execution prices. Slippage, commissions, spreads, liquidity, gaps, volatility, and broker or exchange execution rules can materially affect outcomes. Intrabar price ordering cannot always be determined from OHLC candle data; the indicator's stop-first assumption when a stop and target are touched in the same candle is a conservative modeling convention, not a reconstruction of actual trade execution.
Always conduct your own research and testing, apply appropriate risk management, and consult a qualified financial professional if needed. Never risk money you cannot afford to lose.
**Trade selectively. Respect the criteria. Protect capital first. Skipping a trade is a valid decision.**
發行說明
Removal of comments發行說明
TP2 and TP3 continue to be tracked as bonus milestones, letting you see how much further price moved without making larger profits your primary objective.
發行說明
Added TradeTime slot info to the table發行說明
Few visual additions
免責聲明
這些資訊和出版物並非旨在提供,也不構成TradingView提供或認可的任何形式的財務、投資、交易或其他類型的建議或推薦。請閱讀使用條款以了解更多資訊。
免責聲明
這些資訊和出版物並非旨在提供,也不構成TradingView提供或認可的任何形式的財務、投資、交易或其他類型的建議或推薦。請閱讀使用條款以了解更多資訊。