OPEN-SOURCE SCRIPT
BTC Halving Indicator
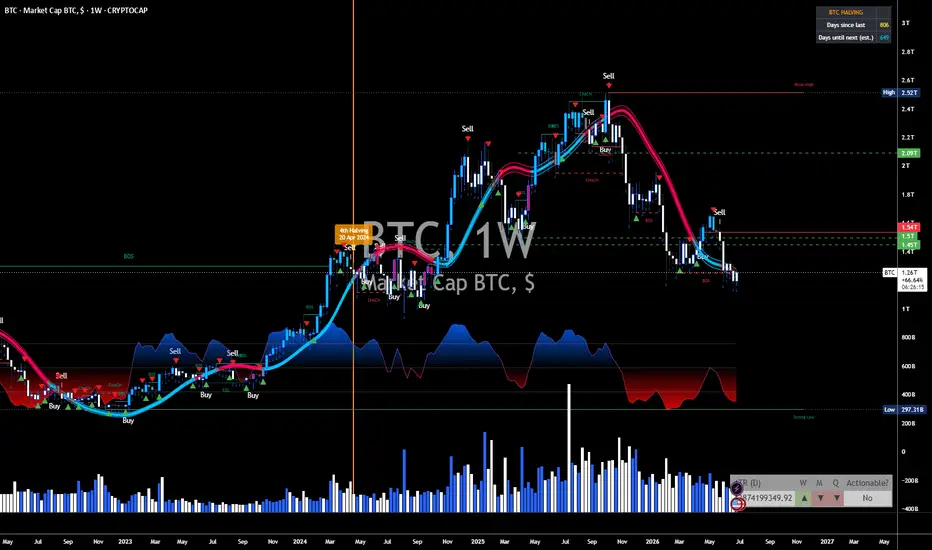
**What it does:**
- Draws an **orange vertical line + label** at each past halving: 28 Nov 2012, 9 Jul 2016, 11 May 2020, and 20 Apr 2024
- Draws a **dashed aqua line** at the estimated 5th halving (~April 2028) when it's close enough to appear on your chart
- Shows a **live counter table** in the top-right: days since the last halving and estimated days until the next one
- Has settings to change colors and toggle the labels/counter on or off
**How to install it in TradingView:**
1. Open a BTC chart (e.g. BTCUSD) on tradingview.com
2. Click **Pine Editor** at the bottom of the screen
3. Delete whatever's in the editor, paste in the full contents of the file
4. Click **Save**, then **Add to chart**
Two tips: use the **daily or weekly timeframe** — on low timeframes like 5m, TradingView doesn't load history back to 2012, so the older halving lines won't appear. And note the 2028 date is an estimate; the actual halving happens at block 1,050,000, so the real date drifts slightly with block times.
Want me to add anything, like cycle-phase background shading or price-at-halving markers?
開源腳本
秉持TradingView一貫精神,這個腳本的創作者將其設為開源,以便交易者檢視並驗證其功能。向作者致敬!您可以免費使用此腳本,但請注意,重新發佈代碼需遵守我們的社群規範。

免責聲明
這些資訊和出版物並非旨在提供,也不構成TradingView提供或認可的任何形式的財務、投資、交易或其他類型的建議或推薦。請閱讀使用條款以了解更多資訊。
開源腳本
秉持TradingView一貫精神,這個腳本的創作者將其設為開源,以便交易者檢視並驗證其功能。向作者致敬!您可以免費使用此腳本,但請注意,重新發佈代碼需遵守我們的社群規範。
免責聲明
這些資訊和出版物並非旨在提供,也不構成TradingView提供或認可的任何形式的財務、投資、交易或其他類型的建議或推薦。請閱讀使用條款以了解更多資訊。