OPEN-SOURCE SCRIPT
Dual Valuation Bands (P/E & P/B) with Z-Score Analysis
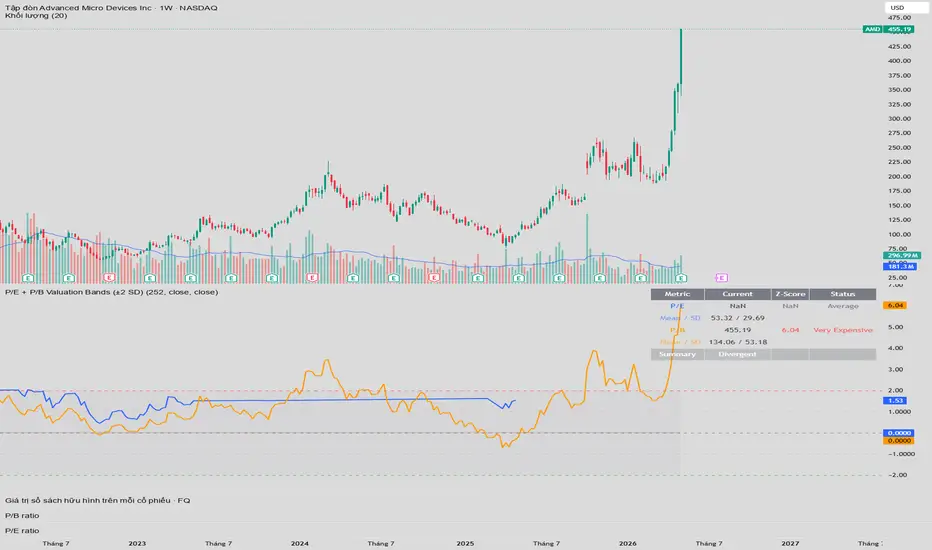
# P/E + P/B Valuation Bands with ±2 Standard Deviation
A dual fundamental valuation indicator that applies statistical Standard Deviation bands to both P/E and P/B ratios, helping investors identify mean-reversion opportunities and extreme valuation zones.
## 📊 What It Does
This indicator calculates rolling Mean and Standard Deviation for both P/E and P/B ratios over a customizable lookback period (default: 252 bars = 1 trading year). It then plots ±1 SD and ±2 SD bands around the mean, providing a statistical framework for identifying:
- **Overvalued zones** (above +2 SD): Statistically expensive — top 2.5% of historical valuations
- **Undervalued zones** (below -2 SD): Statistically cheap — bottom 2.5% of historical valuations
- **Normal range** (within ±1 SD): Where the ratio trades 68% of the time
## ✨ Key Features
### 1. Dual Indicator Display
Plots both P/E and P/B ratios on the same chart, allowing direct comparison and dual-confirmation signals.
### 2. Z-Score Normalization Mode
Toggle between two display modes:
- **Normalized (Z-Score)**: Both ratios plotted on the same scale (number of SDs from mean) — ideal for direct comparison
- **Absolute Values**: Original ratio values with separate SD bands for each — ideal for precise level analysis
### 3. Outlier Filtering
Automatically filters extreme P/E values (negative earnings, P/E > 100) that would distort the standard deviation calculation. Common in cyclical companies during loss periods.
### 4. Dynamic Length Adjustment
Indicator works correctly even with limited historical data by automatically adjusting the calculation window during the warm-up period.
### 5. Dual Confirmation Signals
Background highlights appear only when **both** P/E and P/B simultaneously reach extreme zones (±2 SD), filtering out single-indicator false signals.
### 6. Comprehensive Info Table
Real-time display of:
- Current P/E and P/B values
- Z-Score (number of SDs from mean)
- Valuation status (Very Expensive / Expensive / Average / Cheap / Very Cheap)
- Combined signal summary
## ⚙️ How to Use
### Setup
1. Add a P/E ratio indicator to your chart
2. Add a P/B ratio indicator to your chart
3. Add this "P/E + P/B Valuation Bands" indicator
4. In Settings → Inputs:
- Set "P/E Source" to the P/E ratio output
- Set "P/B Source" to the P/B ratio output
### Recommended Settings by Stock Type
| Stock Type | Length | Notes |
|------------|--------|-------|
| Stable (banks, utilities) | 252–504 | 1–2 years |
| Cyclical (real estate, steel, oil) | 504–1260 | 2–5 years (full cycle) |
| Growth (tech) | 252 | Valuation changes quickly |
| Newly listed | 60–120 | Limited history |
## 🎯 Trading Signals
| P/E | P/B | Signal | Action |
|-----|-----|--------|--------|
| < -2 SD | < -2 SD | **Extremely Cheap (Dual Confirmation)** | Strong accumulation zone |
| < -1 SD | < -1 SD | Cheap | Consider buying |
| Within ±1 SD | Within ±1 SD | Average | Hold / Observe |
| > +1 SD | > +1 SD | Expensive | Consider taking profits |
| > +2 SD | > +2 SD | **Extremely Expensive (Dual Confirmation)** | Strong profit-taking zone |
| Divergent | Divergent | Conflicting signal | Requires deeper analysis |
## 🔍 Interpreting Divergence
When P/E and P/B give conflicting signals:
- **Low P/E + High P/B**: Recent earnings spike not yet reflected in book value growth — verify earnings sustainability
- **High P/E + Low P/B**: Temporary earnings decline but stable assets — potential opportunity if earnings recover
The most reliable signals occur when **both P/E and P/B simultaneously confirm** (background highlights).
## ⚠️ Important Notes
1. **Statistical bands ≠ guaranteed reversal**: A stock can stay overvalued/undervalued for extended periods. Use with other analysis.
2. **Length matters for cyclical stocks**: For commodity, real estate, or banking stocks, use longer lookback periods (504–1260 bars) to capture a full economic cycle.
3. **Outlier filter is critical for P/E**: Without filtering, a single quarter of near-zero earnings can spike P/E to 1000+ and distort the SD calculation for years.
4. **Not a standalone strategy**: This is a fundamental valuation tool. Combine with technical analysis, business fundamentals, and macroeconomic context.
5. **Warm-up period**: The first N bars (where N = length) will not display SD bands due to insufficient data for statistical calculation.
## 📈 Methodology
The indicator applies the empirical rule (68-95-99.7 rule) of normal distribution to fundamental ratios:
- ~68% of values fall within ±1 SD of the mean
- ~95% of values fall within ±2 SD of the mean
- ~99.7% of values fall within ±3 SD of the mean
When a ratio reaches ±2 SD, it represents a statistically significant deviation from its historical norm — a potential mean-reversion opportunity if the underlying business fundamentals remain intact.
## 🛠️ Inputs
- **Length**: SD calculation period (default 252)
- **P/E Source**: Source for P/E ratio data
- **P/B Source**: Source for P/B ratio data
- **Show P/E**: Toggle P/E display
- **Show P/B**: Toggle P/B display
- **Z-Score Normalization**: Plot both ratios on the same scale
- **P/E Outlier Filter**: Filter P/E values outside (0, 100) range
## 🔔 Alerts Available
- Both P/E and P/B above +2 SD (extremely overvalued)
- Both P/E and P/B below -2 SD (extremely undervalued)
---

**Disclaimer**: This indicator is for educational and analytical purposes only. It does not constitute investment advice. Past valuation patterns do not guarantee future performance. Always conduct your own research and consult with a qualified financial advisor before making investment decisions.
A dual fundamental valuation indicator that applies statistical Standard Deviation bands to both P/E and P/B ratios, helping investors identify mean-reversion opportunities and extreme valuation zones.
## 📊 What It Does
This indicator calculates rolling Mean and Standard Deviation for both P/E and P/B ratios over a customizable lookback period (default: 252 bars = 1 trading year). It then plots ±1 SD and ±2 SD bands around the mean, providing a statistical framework for identifying:
- **Overvalued zones** (above +2 SD): Statistically expensive — top 2.5% of historical valuations
- **Undervalued zones** (below -2 SD): Statistically cheap — bottom 2.5% of historical valuations
- **Normal range** (within ±1 SD): Where the ratio trades 68% of the time
## ✨ Key Features
### 1. Dual Indicator Display
Plots both P/E and P/B ratios on the same chart, allowing direct comparison and dual-confirmation signals.
### 2. Z-Score Normalization Mode
Toggle between two display modes:
- **Normalized (Z-Score)**: Both ratios plotted on the same scale (number of SDs from mean) — ideal for direct comparison
- **Absolute Values**: Original ratio values with separate SD bands for each — ideal for precise level analysis
### 3. Outlier Filtering
Automatically filters extreme P/E values (negative earnings, P/E > 100) that would distort the standard deviation calculation. Common in cyclical companies during loss periods.
### 4. Dynamic Length Adjustment
Indicator works correctly even with limited historical data by automatically adjusting the calculation window during the warm-up period.
### 5. Dual Confirmation Signals
Background highlights appear only when **both** P/E and P/B simultaneously reach extreme zones (±2 SD), filtering out single-indicator false signals.
### 6. Comprehensive Info Table
Real-time display of:
- Current P/E and P/B values
- Z-Score (number of SDs from mean)
- Valuation status (Very Expensive / Expensive / Average / Cheap / Very Cheap)
- Combined signal summary
## ⚙️ How to Use
### Setup
1. Add a P/E ratio indicator to your chart
2. Add a P/B ratio indicator to your chart
3. Add this "P/E + P/B Valuation Bands" indicator
4. In Settings → Inputs:
- Set "P/E Source" to the P/E ratio output
- Set "P/B Source" to the P/B ratio output
### Recommended Settings by Stock Type
| Stock Type | Length | Notes |
|------------|--------|-------|
| Stable (banks, utilities) | 252–504 | 1–2 years |
| Cyclical (real estate, steel, oil) | 504–1260 | 2–5 years (full cycle) |
| Growth (tech) | 252 | Valuation changes quickly |
| Newly listed | 60–120 | Limited history |
## 🎯 Trading Signals
| P/E | P/B | Signal | Action |
|-----|-----|--------|--------|
| < -2 SD | < -2 SD | **Extremely Cheap (Dual Confirmation)** | Strong accumulation zone |
| < -1 SD | < -1 SD | Cheap | Consider buying |
| Within ±1 SD | Within ±1 SD | Average | Hold / Observe |
| > +1 SD | > +1 SD | Expensive | Consider taking profits |
| > +2 SD | > +2 SD | **Extremely Expensive (Dual Confirmation)** | Strong profit-taking zone |
| Divergent | Divergent | Conflicting signal | Requires deeper analysis |
## 🔍 Interpreting Divergence
When P/E and P/B give conflicting signals:
- **Low P/E + High P/B**: Recent earnings spike not yet reflected in book value growth — verify earnings sustainability
- **High P/E + Low P/B**: Temporary earnings decline but stable assets — potential opportunity if earnings recover
The most reliable signals occur when **both P/E and P/B simultaneously confirm** (background highlights).
## ⚠️ Important Notes
1. **Statistical bands ≠ guaranteed reversal**: A stock can stay overvalued/undervalued for extended periods. Use with other analysis.
2. **Length matters for cyclical stocks**: For commodity, real estate, or banking stocks, use longer lookback periods (504–1260 bars) to capture a full economic cycle.
3. **Outlier filter is critical for P/E**: Without filtering, a single quarter of near-zero earnings can spike P/E to 1000+ and distort the SD calculation for years.
4. **Not a standalone strategy**: This is a fundamental valuation tool. Combine with technical analysis, business fundamentals, and macroeconomic context.
5. **Warm-up period**: The first N bars (where N = length) will not display SD bands due to insufficient data for statistical calculation.
## 📈 Methodology
The indicator applies the empirical rule (68-95-99.7 rule) of normal distribution to fundamental ratios:
- ~68% of values fall within ±1 SD of the mean
- ~95% of values fall within ±2 SD of the mean
- ~99.7% of values fall within ±3 SD of the mean
When a ratio reaches ±2 SD, it represents a statistically significant deviation from its historical norm — a potential mean-reversion opportunity if the underlying business fundamentals remain intact.
## 🛠️ Inputs
- **Length**: SD calculation period (default 252)
- **P/E Source**: Source for P/E ratio data
- **P/B Source**: Source for P/B ratio data
- **Show P/E**: Toggle P/E display
- **Show P/B**: Toggle P/B display
- **Z-Score Normalization**: Plot both ratios on the same scale
- **P/E Outlier Filter**: Filter P/E values outside (0, 100) range
## 🔔 Alerts Available
- Both P/E and P/B above +2 SD (extremely overvalued)
- Both P/E and P/B below -2 SD (extremely undervalued)
---
**Disclaimer**: This indicator is for educational and analytical purposes only. It does not constitute investment advice. Past valuation patterns do not guarantee future performance. Always conduct your own research and consult with a qualified financial advisor before making investment decisions.
開源腳本
秉持TradingView一貫精神,這個腳本的創作者將其設為開源,以便交易者檢視並驗證其功能。向作者致敬!您可以免費使用此腳本,但請注意,重新發佈代碼需遵守我們的社群規範。

免責聲明
這些資訊和出版物並非旨在提供,也不構成TradingView提供或認可的任何形式的財務、投資、交易或其他類型的建議或推薦。請閱讀使用條款以了解更多資訊。
免責聲明
這些資訊和出版物並非旨在提供,也不構成TradingView提供或認可的任何形式的財務、投資、交易或其他類型的建議或推薦。請閱讀使用條款以了解更多資訊。