OPEN-SOURCE SCRIPT
SMC Supply and Demand Zones [Dots3Red]
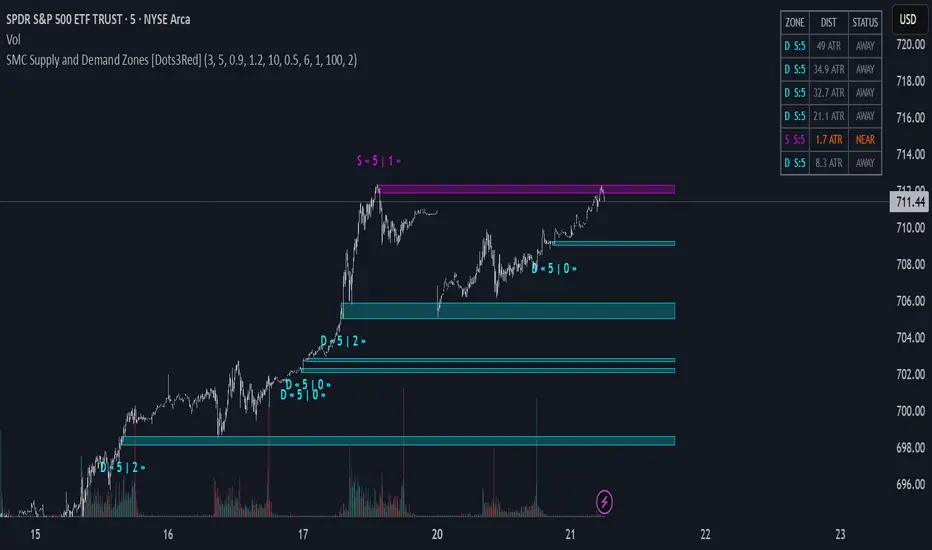
SMC Supply & Demand Zones [Dots3Red]
This script automatically detects and visualizes Smart Money Concept (SMC) Supply and Demand zones using a three-factor confirmation model: base consolidation, impulse breakout, and volume surge.
How zone detection works
The indicator looks for a tight consolidation base (price range below ATR threshold) followed by a strong impulsive candle breaking out of that base with above-average volume. The direction of the breakout determines the zone type — bullish breakout creates a Demand zone, bearish breakout creates a Supply zone. The base range itself becomes the zone, as that is where institutional activity occurred.
Zone scoring (max 5)
Each zone is scored at birth based on three factors:
Higher scoring zones render with stronger fill intensity.
Visual features
Proximity dashboard
A live table in the top-right corner shows all active zones ranked by distance from current price. Each zone displays its type, score, distance in ATR units, and status — INSIDE (gold), NEAR (orange), or AWAY (gray).
Zone invalidation
A zone is considered broken when price closes through it (configurable to wick-based) or when it has been touched too many times — both signals that the institutional order block has been absorbed.
Settings
All key parameters are tunable — base length, ATR multipliers, volume sensitivity, touch limits, score threshold, and proximity distance — making the indicator adaptable to any instrument and timeframe.

This script automatically detects and visualizes Smart Money Concept (SMC) Supply and Demand zones using a three-factor confirmation model: base consolidation, impulse breakout, and volume surge.
How zone detection works
The indicator looks for a tight consolidation base (price range below ATR threshold) followed by a strong impulsive candle breaking out of that base with above-average volume. The direction of the breakout determines the zone type — bullish breakout creates a Demand zone, bearish breakout creates a Supply zone. The base range itself becomes the zone, as that is where institutional activity occurred.
Zone scoring (max 5)
Each zone is scored at birth based on three factors:
- Base tightness — how compressed the consolidation was (1pt)
- Impulse strength — how strong the breakout candle body was relative to ATR (2pts)
- Volume confirmation — whether breakout volume exceeded the MA threshold (2pts)
Higher scoring zones render with stronger fill intensity.
Visual features
- Supply and Demand zones themselves
- Inactive zones (invalidated or max touches reached) can be shown or hidden via toggle
Proximity dashboard
A live table in the top-right corner shows all active zones ranked by distance from current price. Each zone displays its type, score, distance in ATR units, and status — INSIDE (gold), NEAR (orange), or AWAY (gray).
Zone invalidation
A zone is considered broken when price closes through it (configurable to wick-based) or when it has been touched too many times — both signals that the institutional order block has been absorbed.
Settings
All key parameters are tunable — base length, ATR multipliers, volume sensitivity, touch limits, score threshold, and proximity distance — making the indicator adaptable to any instrument and timeframe.
開源腳本
秉持TradingView一貫精神,這個腳本的創作者將其設為開源,以便交易者檢視並驗證其功能。向作者致敬!您可以免費使用此腳本,但請注意,重新發佈代碼需遵守我們的社群規範。

Connect the dots to elevate your trading.
免責聲明
這些資訊和出版物並非旨在提供,也不構成TradingView提供或認可的任何形式的財務、投資、交易或其他類型的建議或推薦。請閱讀使用條款以了解更多資訊。
開源腳本
秉持TradingView一貫精神,這個腳本的創作者將其設為開源,以便交易者檢視並驗證其功能。向作者致敬!您可以免費使用此腳本,但請注意,重新發佈代碼需遵守我們的社群規範。
Connect the dots to elevate your trading.
免責聲明
這些資訊和出版物並非旨在提供,也不構成TradingView提供或認可的任何形式的財務、投資、交易或其他類型的建議或推薦。請閱讀使用條款以了解更多資訊。