OPEN-SOURCE SCRIPT
VolumeMA
VolumeMA
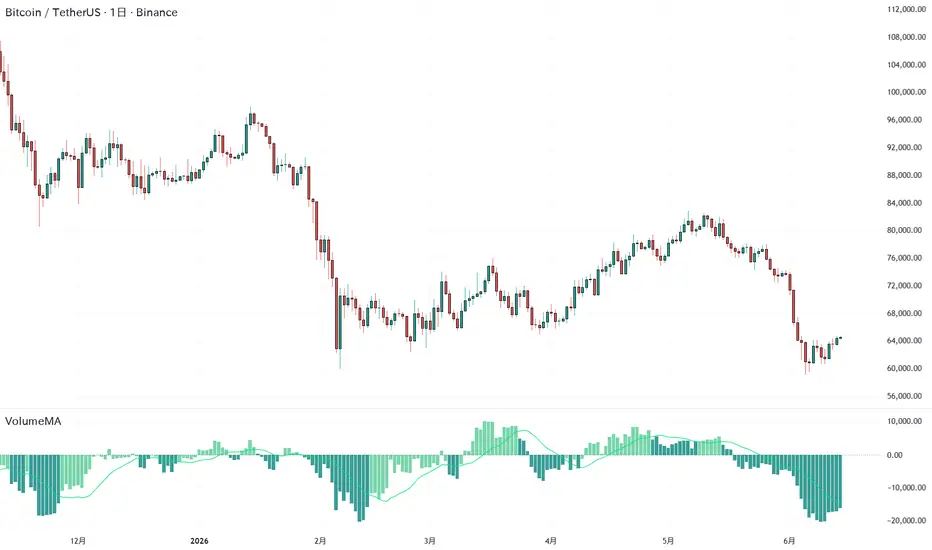
VolumeMA is a volume-based indicator designed to visualize market participation by combining trading volume with price direction.
Unlike traditional volume indicators that display only raw volume, VolumeMA assigns positive volume to rising price bars and negative volume to falling price bars. This helps traders identify whether buying or selling pressure is dominating the market.
The indicator smooths these values using a moving average, reducing short-term noise and making underlying market participation easier to observe.
Features
Directional Volume
Volume is assigned based on price movement:
* Rising price bar → Positive volume
* Falling price bar → Negative volume
This allows traders to quickly identify whether buyers or sellers are currently in control.
Volume Moving Average
The directional volume is smoothed using a Simple Moving Average (SMA), creating the Volume Moving Average histogram.
This helps highlight trends in market participation rather than focusing on individual volume spikes.
SMA Signal Line
An additional SMA is applied to the Volume Moving Average.
When the Volume Moving Average is above its SMA, market participation is considered relatively strong.
When it is below its SMA, market participation is considered relatively weak.
Zero Line
The zero line separates bullish and bearish volume pressure:
* Above zero → Buying pressure dominates
* Below zero → Selling pressure dominates
Color Visualization
Histogram colors automatically change depending on whether the Volume Moving Average is above or below its SMA, making shifts in momentum easier to identify.
Usage
VolumeMA is designed as a complementary tool for market analysis. It can be used alongside price action, trend analysis, and other indicators to better understand market participation and momentum.
As with any indicator, it should not be used in isolation and does not guarantee future performance.
VolumeMA is a volume-based indicator designed to visualize market participation by combining trading volume with price direction.
Unlike traditional volume indicators that display only raw volume, VolumeMA assigns positive volume to rising price bars and negative volume to falling price bars. This helps traders identify whether buying or selling pressure is dominating the market.
The indicator smooths these values using a moving average, reducing short-term noise and making underlying market participation easier to observe.
Features
Directional Volume
Volume is assigned based on price movement:
* Rising price bar → Positive volume
* Falling price bar → Negative volume
This allows traders to quickly identify whether buyers or sellers are currently in control.
Volume Moving Average
The directional volume is smoothed using a Simple Moving Average (SMA), creating the Volume Moving Average histogram.
This helps highlight trends in market participation rather than focusing on individual volume spikes.
SMA Signal Line
An additional SMA is applied to the Volume Moving Average.
When the Volume Moving Average is above its SMA, market participation is considered relatively strong.
When it is below its SMA, market participation is considered relatively weak.
Zero Line
The zero line separates bullish and bearish volume pressure:
* Above zero → Buying pressure dominates
* Below zero → Selling pressure dominates
Color Visualization
Histogram colors automatically change depending on whether the Volume Moving Average is above or below its SMA, making shifts in momentum easier to identify.
Usage
VolumeMA is designed as a complementary tool for market analysis. It can be used alongside price action, trend analysis, and other indicators to better understand market participation and momentum.
As with any indicator, it should not be used in isolation and does not guarantee future performance.
開源腳本
秉持TradingView一貫精神,這個腳本的創作者將其設為開源,以便交易者檢視並驗證其功能。向作者致敬!您可以免費使用此腳本,但請注意,重新發佈代碼需遵守我們的社群規範。

免責聲明
這些資訊和出版物並非旨在提供,也不構成TradingView提供或認可的任何形式的財務、投資、交易或其他類型的建議或推薦。請閱讀使用條款以了解更多資訊。
免責聲明
這些資訊和出版物並非旨在提供,也不構成TradingView提供或認可的任何形式的財務、投資、交易或其他類型的建議或推薦。請閱讀使用條款以了解更多資訊。