OPEN-SOURCE SCRIPT
Impulse Regime Engine [JOAT]
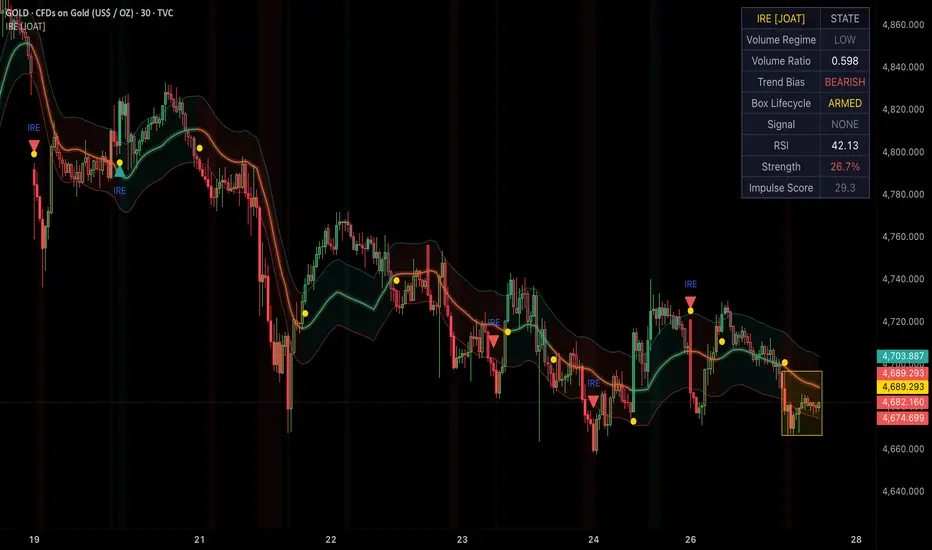
Impulse Regime Engine [JOAT]
Introduction
Impulse Regime Engine [JOAT] is a hybrid breakout-and-trend indicator designed to detect when participation expands, when that expansion compresses into a tradeable box, and when price finally resolves that box with directional intent. It combines a volume regime engine with an RSI-projected price trend framework, creating a clean overlay built for timing impulsive releases without sacrificing directional context.
This indicator is especially useful for traders who like breakout structures but do not want to trade every range break blindly. The regime box defines the event. The projected trend framework defines the context.

Why This Indicator Exists
Core Components Explained
1. Volume Regime Engine
Pine Script®
Volume is classified into Low, Normal, High, and Extreme states by comparing short-term participation to a longer-term baseline. Only elevated regimes are allowed to build a valid impulse box.
2. Regime Box Lifecycle
The script now includes a cooldown between resolved boxes so repeated high-volume churn does not keep repainting fresh structures on every minor burst.
3. RSI Projection Framework
Pine Script®
Instead of reading RSI only as a sub-pane oscillator, the script converts RSI into projected price space. This produces a trend reference line directly on the chart.
4. Dynamic Tolerance Bands
Pine Script®
Price above the upper band confirms bullish projected trend. Price below the lower band confirms bearish projected trend. This acts like a directional bias filter around the projection basis.
5. Breakout Risk Framework
When price resolves the armed box, the script can draw one stop and three profit levels using either ATR-derived or percentage-derived distance. The lines auto-expire so old trade maps do not crowd the chart.
Visual Elements
Input Parameters
Regime Engine:
Trend Projection:
Risk Framework:
How to Use This Indicator
Step 1: Wait for elevated participation to build the impulse box.
Step 2: Let the box transition into the armed state.
Step 3: Read whether projected trend bias agrees with the likely breakout direction.
Step 4: Use confirmed breaks, not intrabar pokes, as the actual event trigger.
Step 5: Manage the trade against the active risk map or your own execution rules.
Best Practices
Indicator Limitations
Technical Implementation
Built in Pine Script v6 using:
Originality Statement
This indicator is original in the way it combines regime participation, lifecycle breakout structure, and projected momentum context into one overlay. Its edge is not just detecting expansion, but framing when expansion is worth respecting.
Disclaimer
This indicator is provided for educational and informational purposes only. It is not financial advice. Breakout trading involves risk, including false breaks and fast reversals. Always manage risk carefully and confirm signals with your own process.
-Made with passion by officialjackofalltrades
Introduction
Impulse Regime Engine [JOAT] is a hybrid breakout-and-trend indicator designed to detect when participation expands, when that expansion compresses into a tradeable box, and when price finally resolves that box with directional intent. It combines a volume regime engine with an RSI-projected price trend framework, creating a clean overlay built for timing impulsive releases without sacrificing directional context.
This indicator is especially useful for traders who like breakout structures but do not want to trade every range break blindly. The regime box defines the event. The projected trend framework defines the context.
Why This Indicator Exists
- Participation Regime Classification: Distinguishes low-quality price movement from meaningful volume expansion
- Lifecycle-Based Box Engine: Separates the setup into building, armed, and resolved states
- Projected Trend Overlay: Maps RSI into price space for contextual trend direction
- Strength-Based Candle Coloring: Visualizes conviction without overloading the chart
- Active Risk Map: Adds optional stop and target staging after valid breaks
Core Components Explained
1. Volume Regime Engine
Volume is classified into Low, Normal, High, and Extreme states by comparing short-term participation to a longer-term baseline. Only elevated regimes are allowed to build a valid impulse box.
2. Regime Box Lifecycle
- Building: While elevated volume persists, the box expands to contain the active burst
- Armed: Once the burst cools, the box freezes and waits for release
- Resolved: A confirmed close beyond the boundary triggers the breakout event and resets the cycle
The script now includes a cooldown between resolved boxes so repeated high-volume churn does not keep repainting fresh structures on every minor burst.
3. RSI Projection Framework
Instead of reading RSI only as a sub-pane oscillator, the script converts RSI into projected price space. This produces a trend reference line directly on the chart.
4. Dynamic Tolerance Bands
Price above the upper band confirms bullish projected trend. Price below the lower band confirms bearish projected trend. This acts like a directional bias filter around the projection basis.
5. Breakout Risk Framework
When price resolves the armed box, the script can draw one stop and three profit levels using either ATR-derived or percentage-derived distance. The lines auto-expire so old trade maps do not crowd the chart.
Visual Elements
- Regime Box: Semi-transparent box during build and armed phases
- Projection Basis: Gold-accent projected trend line
- Tolerance Bands: Bull and bear projection boundaries
- Gradient Candles: Optional candle coloring by directional strength
- Breakout Markers: Compact IRE triangles on confirmed release
- TP/SL Lines: Optional risk staging while the active breakout remains valid
- Dashboard: Volume regime, ratio, bias, box state, signal state, RSI, and strength
Input Parameters
Regime Engine:
- Short / Long Volume MA
- Low / Normal / High thresholds
- Max build bars
- Max armed bars
- New box cooldown bars
Trend Projection:
- RSI length and smoothing
- Projection range bars
- Projection EMA
- Tolerance multiplier
- Strength lookback
Risk Framework:
- ATR period
- ATR stop multiplier
- TP1 / TP2 / TP3 risk-reward ratios
- TP/SL maximum life
How to Use This Indicator
Step 1: Wait for elevated participation to build the impulse box.
Step 2: Let the box transition into the armed state.
Step 3: Read whether projected trend bias agrees with the likely breakout direction.
Step 4: Use confirmed breaks, not intrabar pokes, as the actual event trigger.
Step 5: Manage the trade against the active risk map or your own execution rules.
Best Practices
- Use on instruments with reliable participation data
- Prefer breakouts aligned with the projected trend state
- Treat extreme volume bursts as high-opportunity but also high-volatility events
- Use the cooldown to avoid overreacting in noisy compression cycles
- Disable extra visuals if you want a cleaner execution chart
Indicator Limitations
- Volume regime logic depends on the quality of the feed
- Not every armed box will produce a sustained move
- Projected RSI trend is a contextual guide, not a guarantee
- Breakouts can fail or reverse quickly in low liquidity
- Repeated tests of the same area reduce signal quality
Technical Implementation
Built in Pine Script v6 using:
- Short-vs-long volume regime classification
- Stateful box lifecycle logic
- RSI-to-price projection
- Body-based tolerance bands
- Strength-gradient candle coloring
- Optional ATR or percent risk mapping
- Confirmed-bar breakout and trend-shift alerts
Originality Statement
This indicator is original in the way it combines regime participation, lifecycle breakout structure, and projected momentum context into one overlay. Its edge is not just detecting expansion, but framing when expansion is worth respecting.
Disclaimer
This indicator is provided for educational and informational purposes only. It is not financial advice. Breakout trading involves risk, including false breaks and fast reversals. Always manage risk carefully and confirm signals with your own process.
-Made with passion by officialjackofalltrades
開源腳本
秉持TradingView一貫精神,這個腳本的創作者將其設為開源,以便交易者檢視並驗證其功能。向作者致敬!您可以免費使用此腳本,但請注意,重新發佈代碼需遵守我們的社群規範。

The Institutional Grade Trading Ecosystem, Built to win trades 📈
Get Access 👇
jackofalltrades.vip 🌐
t.me/jackofalltradesvip 🃏
Get Access 👇
jackofalltrades.vip 🌐
t.me/jackofalltradesvip 🃏
免責聲明
這些資訊和出版物並非旨在提供,也不構成TradingView提供或認可的任何形式的財務、投資、交易或其他類型的建議或推薦。請閱讀使用條款以了解更多資訊。
開源腳本
秉持TradingView一貫精神,這個腳本的創作者將其設為開源,以便交易者檢視並驗證其功能。向作者致敬!您可以免費使用此腳本,但請注意,重新發佈代碼需遵守我們的社群規範。
The Institutional Grade Trading Ecosystem, Built to win trades 📈
Get Access 👇
jackofalltrades.vip 🌐
t.me/jackofalltradesvip 🃏
Get Access 👇
jackofalltrades.vip 🌐
t.me/jackofalltradesvip 🃏
免責聲明
這些資訊和出版物並非旨在提供,也不構成TradingView提供或認可的任何形式的財務、投資、交易或其他類型的建議或推薦。請閱讀使用條款以了解更多資訊。