已更新
Willams %R with 13 EMA - TRI
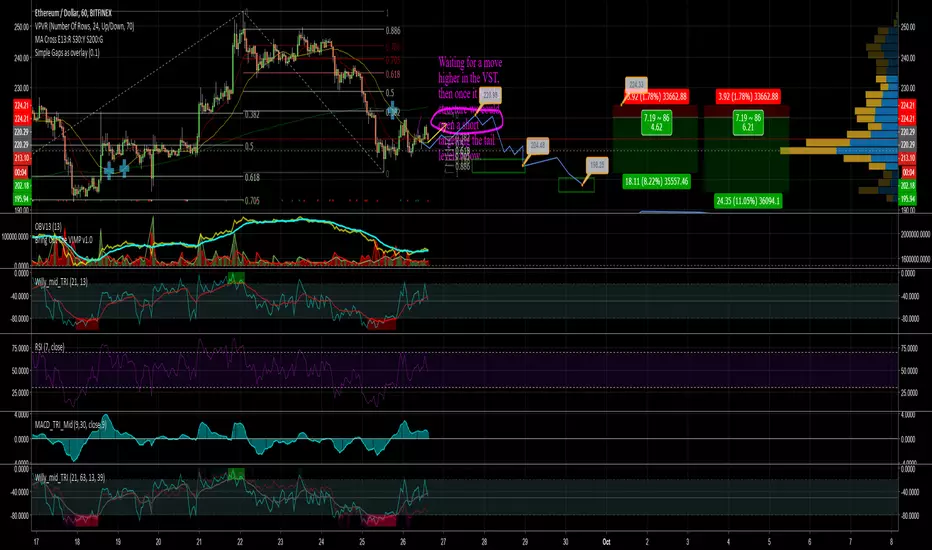
Based on alexpunct's work.
I simply added a second Willy plot and EMA which allows you to plot Willy and its EMA for a second time frame on the same chart.
The idea is that you will only enter a trade if there is confluence on the two time frames i.e. Willy is stupidly oversold/overbought on both the 4h and 12h or 1h and 4h time frames.
I will be testing this and will adapt
I simply added a second Willy plot and EMA which allows you to plot Willy and its EMA for a second time frame on the same chart.
The idea is that you will only enter a trade if there is confluence on the two time frames i.e. Willy is stupidly oversold/overbought on both the 4h and 12h or 1h and 4h time frames.
I will be testing this and will adapt
發行說明
Fixed some little errors and added correct subtitles
免責聲明
這些資訊和出版物並非旨在提供,也不構成TradingView提供或認可的任何形式的財務、投資、交易或其他類型的建議或推薦。請閱讀使用條款以了解更多資訊。
免責聲明
這些資訊和出版物並非旨在提供,也不構成TradingView提供或認可的任何形式的財務、投資、交易或其他類型的建議或推薦。請閱讀使用條款以了解更多資訊。