OPEN-SOURCE SCRIPT
Blue Sky (All-Time High) HUD
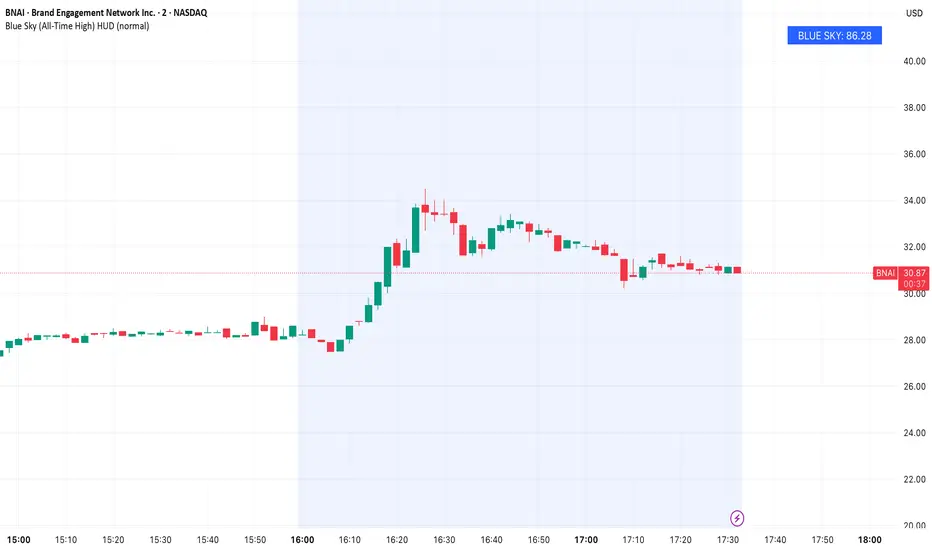
Blue Sky at a Glance
Blue Sky (All-Time High) HUD is a fixed, price-overlay indicator designed to instantly show a stock’s highest price achieved within the loaded chart history, without requiring you to zoom out or scan manually.
Instead of drawing cluttered historical markers, this script calculates the running all-time high and displays it in a clean, fixed HUD anchored to the top-right of the chart.
How It Works
The script continuously tracks the highest high reached on the chart and updates in real time as new highs are made.
The current Blue Sky value is:
Highest high observed within the loaded chart history
The value is displayed in two ways:
• A fixed HUD panel for quick visual reference
• The indicator status line for fast numerical reading
An optional horizontal line can be enabled to visualize the exact level on the chart.
How to Use It
This indicator is informational, not predictive.
Common use cases:
• Instantly see how far price is from its all-time high
• Evaluate overhead supply vs open air
• Contextualize breakouts relative to historical extremes
• Assess long-term expansion potential
Examples:
• Price approaching Blue Sky may indicate major breakout tests
• Price far below Blue Sky may signal long-term recovery room
• New highs automatically update the level in real time
Customization
You can adjust:
• Font size of the HUD display
• Optional visibility of the all-time high line
Design Philosophy
• Fixed, non-moving HUD
• No separate pane
• No repainting
• Lightweight and unobtrusive
• Built for instant context at a glance
This tool is designed for traders who want immediate awareness of a stock’s historical ceiling without disrupting price structure.
Blue Sky (All-Time High) HUD is a fixed, price-overlay indicator designed to instantly show a stock’s highest price achieved within the loaded chart history, without requiring you to zoom out or scan manually.
Instead of drawing cluttered historical markers, this script calculates the running all-time high and displays it in a clean, fixed HUD anchored to the top-right of the chart.
How It Works
The script continuously tracks the highest high reached on the chart and updates in real time as new highs are made.
The current Blue Sky value is:
Highest high observed within the loaded chart history
The value is displayed in two ways:
• A fixed HUD panel for quick visual reference
• The indicator status line for fast numerical reading
An optional horizontal line can be enabled to visualize the exact level on the chart.
How to Use It
This indicator is informational, not predictive.
Common use cases:
• Instantly see how far price is from its all-time high
• Evaluate overhead supply vs open air
• Contextualize breakouts relative to historical extremes
• Assess long-term expansion potential
Examples:
• Price approaching Blue Sky may indicate major breakout tests
• Price far below Blue Sky may signal long-term recovery room
• New highs automatically update the level in real time
Customization
You can adjust:
• Font size of the HUD display
• Optional visibility of the all-time high line
Design Philosophy
• Fixed, non-moving HUD
• No separate pane
• No repainting
• Lightweight and unobtrusive
• Built for instant context at a glance
This tool is designed for traders who want immediate awareness of a stock’s historical ceiling without disrupting price structure.
開源腳本
秉持TradingView一貫精神,這個腳本的創作者將其設為開源,以便交易者檢視並驗證其功能。向作者致敬!您可以免費使用此腳本,但請注意,重新發佈代碼需遵守我們的社群規範。

免責聲明
這些資訊和出版物並非旨在提供,也不構成TradingView提供或認可的任何形式的財務、投資、交易或其他類型的建議或推薦。請閱讀使用條款以了解更多資訊。
開源腳本
秉持TradingView一貫精神,這個腳本的創作者將其設為開源,以便交易者檢視並驗證其功能。向作者致敬!您可以免費使用此腳本,但請注意,重新發佈代碼需遵守我們的社群規範。
免責聲明
這些資訊和出版物並非旨在提供,也不構成TradingView提供或認可的任何形式的財務、投資、交易或其他類型的建議或推薦。請閱讀使用條款以了解更多資訊。