JMZ indicator V8.3
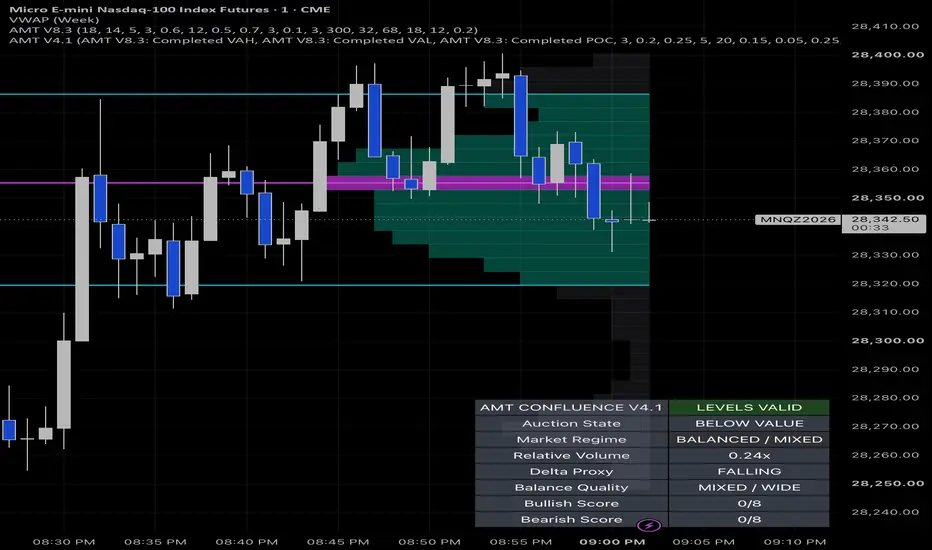
# AMT 8.3V — Advanced Auction Market Theory | Market Structure & Trading Confluence
### Overview
**AMT 8.3V** is an advanced technical analysis indicator designed around the principles of **Auction Market Theory (AMT)**, market structure, price action, and institutional trading behavior.
The indicator is designed to help traders better understand how financial markets operate through the continuous interaction between buyers and sellers, providing a structured approach to identifying potential trading opportunities, recognizing changing market conditions, and improving execution decisions.
Rather than relying exclusively on traditional lagging indicators, AMT 8.3V focuses on understanding the underlying behavior of price, identifying important market locations, and recognizing conditions that may suggest continuation, rejection, exhaustion, or reversal.
The primary objective of AMT 8.3V is not to predict every market movement. Instead, it is to help traders develop a clearer understanding of **where price is trading, how price is behaving, and what conditions may justify entering or avoiding a trade.**
Built with active traders in mind, AMT 8.3V can be incorporated into scalping, intraday trading, and broader technical analysis across multiple financial markets.
---
## 1. The Philosophy Behind AMT 8.3V
Financial markets operate through an ongoing auction process.
Buyers and sellers continuously interact to establish prices at which transactions can occur. As market participants respond to changing conditions, price moves between areas of perceived value, acceptance, and rejection.
Auction Market Theory provides a framework for interpreting these movements.
AMT 8.3V is built around several fundamental principles:
- **Market Acceptance:** Price may establish sustained trading activity within an area, suggesting that market participants are comfortable conducting business at those prices.
- **Market Rejection:** Price may enter an area and quickly move away, potentially indicating that participants are unwilling to maintain transactions at those levels.
- **Balance:** Buyers and sellers reach a temporary equilibrium, often resulting in consolidation or rotational price behavior.
- **Imbalance:** One side of the market gains control, potentially creating directional movement and price expansion.
- **Price Discovery:** Markets move beyond previously established trading areas in search of new levels where buyers and sellers are willing to transact.
Understanding these conditions is essential because the same trading setup can produce different outcomes depending on the surrounding market environment.
A breakout occurring during strong directional price discovery, for example, may behave differently from a breakout occurring within a balanced, rotational market.
AMT 8.3V is intended to help traders evaluate these distinctions before committing capital.
---
## 2. Market Structure and Price Behavior
Market structure is one of the foundations of technical analysis.
By examining the relationship between swing highs, swing lows, directional movement, and consolidation, traders can develop a better understanding of current market conditions.
AMT 8.3V is designed to complement this process by helping traders interpret price behavior within a broader auction framework.
Important structural concepts include:
**Bullish Market Structure**
A market displaying higher highs and higher lows may indicate sustained buying pressure and upward directional control.
**Bearish Market Structure**
A market displaying lower highs and lower lows may indicate sustained selling pressure and downward directional control.
**Balanced Market Structure**
When price repeatedly rotates between established boundaries without sustained directional progress, the market may be experiencing temporary equilibrium.
**Structural Transitions**
Changes in price behavior may suggest that the existing market condition is weakening and that a new directional phase could be developing.
These distinctions allow traders to approach the market with greater context rather than treating every price movement as an independent trading opportunity.
---
## 3. Auction Market Theory and Volume Profile Integration
One of the most powerful applications of AMT 8.3V is its ability to be incorporated into a trading methodology that uses Volume Profile.
Volume Profile provides information about how trading volume is distributed across different price levels.
When used alongside an auction-based trading framework, it can help traders distinguish between areas of established value and areas where price may experience faster movement.
Three particularly important Volume Profile references are:
### Point of Control (POC)
The Point of Control represents the price level with the highest traded volume within the selected profile.
This level can serve as an important reference for evaluating market acceptance, rotational behavior, and potential reactions.
### Value Area High (VAH)
The Value Area High represents the upper boundary of the selected volume profile's value area.
Traders may observe whether price rejects this boundary, rotates back toward value, or establishes acceptance above it.
### Value Area Low (VAL)
The Value Area Low represents the lower boundary of the selected value area.
Similar to VAH, this level can provide context for evaluating potential rejection, acceptance, or directional continuation.
**An important distinction:** Volume Profile levels do not automatically represent support or resistance, nor do they guarantee a reaction.
Their significance depends on the surrounding market structure, current auction conditions, and actual price behavior.
AMT 8.3V can be used as an additional analytical layer when evaluating these locations.
---
## 4. Identifying Balance and Imbalance
One of the most important skills in trading is recognizing when a market is balanced and when it is transitioning into directional movement.
### Balanced Market Conditions
Balanced markets commonly display overlapping price action, repeated rotations, and limited directional follow-through.
Under these conditions, traders may focus on:
- Reactions around established value boundaries.
- Failed attempts to sustain movement outside a trading range.
- Rotations toward previously accepted prices.
- Avoiding aggressive continuation entries without sufficient confirmation.
### Imbalanced Market Conditions
Imbalanced markets may display stronger directional movement, expanding price ranges, and sustained trading beyond previously established boundaries.
Under these conditions, traders may focus on:
- Directional continuation.
- Successful breakouts followed by acceptance.
- Pullbacks toward important structural locations.
- Avoiding premature countertrend positions.
Recognizing the difference between these environments can help traders avoid applying the same execution model to every market condition.
---
## 5. Trading Confluence and Confirmation
AMT 8.3V is intended to function as part of a broader decision-making process rather than as a standalone guarantee of profitable trades.
A trading opportunity becomes more meaningful when multiple independent observations support the same market interpretation.
Potential complementary tools include:
**Volume Profile:** Establishes important price references through traded-volume distribution.
**Session, Weekly, and Monthly VWAP:** Provides volume-weighted price benchmarks across different periods.
**Cumulative Volume Delta (CVD):** Helps traders evaluate the relationship between aggressive buying and aggressive selling.
**Order Flow and Large Trade Activity:** Provides additional information about transactions and participation at important price levels.
**Market Structure:** Helps establish directional context and identify potential transitions in market behavior.
**Price Action:** Provides the final observable evidence of acceptance, rejection, or continuation.
For example, a trader may identify price approaching a significant volume-profile boundary while market structure suggests a potential directional transition.
Instead of entering immediately, the trader may wait for price to demonstrate rejection, a structural shift, or another predefined confirmation.
The objective is to build a repeatable process based on observable market conditions rather than impulsive decision-making.
**Confluence improves the amount of information available to the trader, but it does not automatically increase the statistical probability of a successful trade.** Any claimed performance advantage should be established through testing.
---
## 6. Potential Trading Applications
AMT 8.3V can be incorporated into several different trading approaches.
### Rejection-Based Trading
Traders identify important market locations and observe whether price fails to establish acceptance beyond them.
A potential rejection setup may involve price testing a significant level, failing to sustain movement, and returning toward a previously accepted trading area.
### Continuation Trading
Traders identify directional market conditions and look for opportunities to participate in the prevailing movement.
Potential continuation opportunities may develop following successful acceptance outside an established range or after a controlled pullback.
### Breakout and Acceptance Trading
Not every breakout represents meaningful directional commitment.
A breakout that quickly returns inside its previous range may indicate failed price discovery.
Conversely, sustained trading outside an established area may support a continuation scenario.
AMT 8.3V is intended to complement the evaluation of these conditions.
### Intraday Scalping
Short-term traders can incorporate auction principles into lower-timeframe execution.
However, lower timeframes may contain increased market noise, transaction costs, and false signals.
Traders should consider higher-timeframe context and predefined risk parameters before executing.
---
## 7. Multi-Timeframe Analysis
Markets operate across multiple timeframes, and short-term price movements often develop within larger market structures.
AMT 8.3V can be incorporated into a top-down analytical process.
**Higher Timeframes**
Identify broader market direction, significant trading ranges, and major structural locations.
**Intermediate Timeframes**
Evaluate developing market conditions, local structure, and potential areas of interest.
**Lower Timeframes**
Observe price behavior around those areas and determine whether predefined entry conditions have been satisfied.
This approach helps traders distinguish between a short-term reaction and a potentially meaningful change in the broader market environment.
---
## 8. Risk Management and Execution
No technical indicator can eliminate market uncertainty.
AMT 8.3V should be used alongside a consistent risk-management framework.
Traders should establish the following before entering a position:
- A clearly defined reason for entering.
- A predetermined invalidation level.
- An appropriate stop-loss location.
- A realistic profit objective.
- Position sizing consistent with account risk.
- A plan for managing unexpected volatility.
Limit orders may provide greater control over execution price, but they do not guarantee fills and may result in missed opportunities.
Market orders prioritize execution but may experience slippage, especially during volatile market conditions.
Neither execution method is universally superior.
The appropriate choice depends on the trading strategy, liquidity, volatility, and individual risk tolerance.
---
## 9. Markets and Trading Styles
AMT 8.3V is intended for use within technical-analysis workflows across a variety of liquid financial markets, including:
- Nasdaq futures (NQ / MNQ)
- S&P 500 futures (ES / MES)
- Gold futures (GC / MGC)
- Silver futures
- Forex
- Equity indices
- Stocks
- Cryptocurrency markets
The indicator's practical usefulness may vary depending on market characteristics, timeframe, available data, and the trader's execution methodology.
Auction-based concepts can be applied across different markets, but identical settings or trading rules should not be assumed to produce identical results.
---
## 10. The Importance of Patience and Discipline
One of the central ideas behind AMT 8.3V is that successful trading decisions require more than simply identifying a potential entry.
A trader must also determine whether the surrounding market environment supports the intended trade.
Not every movement requires participation.
Not every breakout deserves an entry.
Not every rejection indicates a reversal.
And not every technically valid setup offers an acceptable risk-to-reward opportunity.
AMT 8.3V is designed to encourage traders to prioritize market context, confirmation, and disciplined execution.
The objective is to develop a structured approach that can be evaluated, refined, and consistently applied over time.
---
## 11. Recommended Testing and Development
Before incorporating AMT 8.3V into live trading, users are encouraged to conduct historical testing and forward testing.
Important performance metrics include:
- Win rate.
- Average winning trade.
- Average losing trade.
- Average realized risk-to-reward ratio.
- Maximum drawdown.
- Profit factor.
- Performance across different market conditions.
- Execution costs, commissions, and slippage.
Historical results should not be treated as guarantees of future performance.
Forward testing in simulated market conditions can help traders evaluate how the indicator fits into their actual execution process.
A sufficiently large sample of trades is important when attempting to determine whether a strategy demonstrates a repeatable statistical advantage.
---
## 12. Final Thoughts
**AMT 8.3V is built around one central principle: understanding market behavior is more valuable than attempting to predict every price movement.**
Financial markets are dynamic environments in which buyers and sellers continuously respond to liquidity, perceived value, volatility, and changing expectations.
By incorporating Auction Market Theory, market structure, Volume Profile context, and additional confirmation tools, traders can develop a more organized approach to interpreting these conditions.
The purpose of AMT 8.3V is to support that process by encouraging context-driven analysis, patient execution, and disciplined risk management.
It is not intended to replace independent judgment or guarantee trading success.
**Trade the conditions, not the expectations.**
**Understand the auction. Respect the structure. Execute with discipline.**
---
### Disclaimer
AMT 8.3V is intended for educational and informational purposes only. It does not constitute financial advice, investment recommendations, or a guarantee of future results.
Trading futures, forex, equities, and other financial instruments involves substantial risk and may result in significant financial losses.
No indicator, strategy, or analytical framework can guarantee profitable trading outcomes.
Users are responsible for their own trading decisions, position sizing, and risk management.
Past performance is not indicative of future results.
### Overview
**AMT 8.3V** is an advanced technical analysis indicator designed around the principles of **Auction Market Theory (AMT)**, market structure, price action, and institutional trading behavior.
The indicator is designed to help traders better understand how financial markets operate through the continuous interaction between buyers and sellers, providing a structured approach to identifying potential trading opportunities, recognizing changing market conditions, and improving execution decisions.
Rather than relying exclusively on traditional lagging indicators, AMT 8.3V focuses on understanding the underlying behavior of price, identifying important market locations, and recognizing conditions that may suggest continuation, rejection, exhaustion, or reversal.
The primary objective of AMT 8.3V is not to predict every market movement. Instead, it is to help traders develop a clearer understanding of **where price is trading, how price is behaving, and what conditions may justify entering or avoiding a trade.**
Built with active traders in mind, AMT 8.3V can be incorporated into scalping, intraday trading, and broader technical analysis across multiple financial markets.
---
## 1. The Philosophy Behind AMT 8.3V
Financial markets operate through an ongoing auction process.
Buyers and sellers continuously interact to establish prices at which transactions can occur. As market participants respond to changing conditions, price moves between areas of perceived value, acceptance, and rejection.
Auction Market Theory provides a framework for interpreting these movements.
AMT 8.3V is built around several fundamental principles:
- **Market Acceptance:** Price may establish sustained trading activity within an area, suggesting that market participants are comfortable conducting business at those prices.
- **Market Rejection:** Price may enter an area and quickly move away, potentially indicating that participants are unwilling to maintain transactions at those levels.
- **Balance:** Buyers and sellers reach a temporary equilibrium, often resulting in consolidation or rotational price behavior.
- **Imbalance:** One side of the market gains control, potentially creating directional movement and price expansion.
- **Price Discovery:** Markets move beyond previously established trading areas in search of new levels where buyers and sellers are willing to transact.
Understanding these conditions is essential because the same trading setup can produce different outcomes depending on the surrounding market environment.
A breakout occurring during strong directional price discovery, for example, may behave differently from a breakout occurring within a balanced, rotational market.
AMT 8.3V is intended to help traders evaluate these distinctions before committing capital.
---
## 2. Market Structure and Price Behavior
Market structure is one of the foundations of technical analysis.
By examining the relationship between swing highs, swing lows, directional movement, and consolidation, traders can develop a better understanding of current market conditions.
AMT 8.3V is designed to complement this process by helping traders interpret price behavior within a broader auction framework.
Important structural concepts include:
**Bullish Market Structure**
A market displaying higher highs and higher lows may indicate sustained buying pressure and upward directional control.
**Bearish Market Structure**
A market displaying lower highs and lower lows may indicate sustained selling pressure and downward directional control.
**Balanced Market Structure**
When price repeatedly rotates between established boundaries without sustained directional progress, the market may be experiencing temporary equilibrium.
**Structural Transitions**
Changes in price behavior may suggest that the existing market condition is weakening and that a new directional phase could be developing.
These distinctions allow traders to approach the market with greater context rather than treating every price movement as an independent trading opportunity.
---
## 3. Auction Market Theory and Volume Profile Integration
One of the most powerful applications of AMT 8.3V is its ability to be incorporated into a trading methodology that uses Volume Profile.
Volume Profile provides information about how trading volume is distributed across different price levels.
When used alongside an auction-based trading framework, it can help traders distinguish between areas of established value and areas where price may experience faster movement.
Three particularly important Volume Profile references are:
### Point of Control (POC)
The Point of Control represents the price level with the highest traded volume within the selected profile.
This level can serve as an important reference for evaluating market acceptance, rotational behavior, and potential reactions.
### Value Area High (VAH)
The Value Area High represents the upper boundary of the selected volume profile's value area.
Traders may observe whether price rejects this boundary, rotates back toward value, or establishes acceptance above it.
### Value Area Low (VAL)
The Value Area Low represents the lower boundary of the selected value area.
Similar to VAH, this level can provide context for evaluating potential rejection, acceptance, or directional continuation.
**An important distinction:** Volume Profile levels do not automatically represent support or resistance, nor do they guarantee a reaction.
Their significance depends on the surrounding market structure, current auction conditions, and actual price behavior.
AMT 8.3V can be used as an additional analytical layer when evaluating these locations.
---
## 4. Identifying Balance and Imbalance
One of the most important skills in trading is recognizing when a market is balanced and when it is transitioning into directional movement.
### Balanced Market Conditions
Balanced markets commonly display overlapping price action, repeated rotations, and limited directional follow-through.
Under these conditions, traders may focus on:
- Reactions around established value boundaries.
- Failed attempts to sustain movement outside a trading range.
- Rotations toward previously accepted prices.
- Avoiding aggressive continuation entries without sufficient confirmation.
### Imbalanced Market Conditions
Imbalanced markets may display stronger directional movement, expanding price ranges, and sustained trading beyond previously established boundaries.
Under these conditions, traders may focus on:
- Directional continuation.
- Successful breakouts followed by acceptance.
- Pullbacks toward important structural locations.
- Avoiding premature countertrend positions.
Recognizing the difference between these environments can help traders avoid applying the same execution model to every market condition.
---
## 5. Trading Confluence and Confirmation
AMT 8.3V is intended to function as part of a broader decision-making process rather than as a standalone guarantee of profitable trades.
A trading opportunity becomes more meaningful when multiple independent observations support the same market interpretation.
Potential complementary tools include:
**Volume Profile:** Establishes important price references through traded-volume distribution.
**Session, Weekly, and Monthly VWAP:** Provides volume-weighted price benchmarks across different periods.
**Cumulative Volume Delta (CVD):** Helps traders evaluate the relationship between aggressive buying and aggressive selling.
**Order Flow and Large Trade Activity:** Provides additional information about transactions and participation at important price levels.
**Market Structure:** Helps establish directional context and identify potential transitions in market behavior.
**Price Action:** Provides the final observable evidence of acceptance, rejection, or continuation.
For example, a trader may identify price approaching a significant volume-profile boundary while market structure suggests a potential directional transition.
Instead of entering immediately, the trader may wait for price to demonstrate rejection, a structural shift, or another predefined confirmation.
The objective is to build a repeatable process based on observable market conditions rather than impulsive decision-making.
**Confluence improves the amount of information available to the trader, but it does not automatically increase the statistical probability of a successful trade.** Any claimed performance advantage should be established through testing.
---
## 6. Potential Trading Applications
AMT 8.3V can be incorporated into several different trading approaches.
### Rejection-Based Trading
Traders identify important market locations and observe whether price fails to establish acceptance beyond them.
A potential rejection setup may involve price testing a significant level, failing to sustain movement, and returning toward a previously accepted trading area.
### Continuation Trading
Traders identify directional market conditions and look for opportunities to participate in the prevailing movement.
Potential continuation opportunities may develop following successful acceptance outside an established range or after a controlled pullback.
### Breakout and Acceptance Trading
Not every breakout represents meaningful directional commitment.
A breakout that quickly returns inside its previous range may indicate failed price discovery.
Conversely, sustained trading outside an established area may support a continuation scenario.
AMT 8.3V is intended to complement the evaluation of these conditions.
### Intraday Scalping
Short-term traders can incorporate auction principles into lower-timeframe execution.
However, lower timeframes may contain increased market noise, transaction costs, and false signals.
Traders should consider higher-timeframe context and predefined risk parameters before executing.
---
## 7. Multi-Timeframe Analysis
Markets operate across multiple timeframes, and short-term price movements often develop within larger market structures.
AMT 8.3V can be incorporated into a top-down analytical process.
**Higher Timeframes**
Identify broader market direction, significant trading ranges, and major structural locations.
**Intermediate Timeframes**
Evaluate developing market conditions, local structure, and potential areas of interest.
**Lower Timeframes**
Observe price behavior around those areas and determine whether predefined entry conditions have been satisfied.
This approach helps traders distinguish between a short-term reaction and a potentially meaningful change in the broader market environment.
---
## 8. Risk Management and Execution
No technical indicator can eliminate market uncertainty.
AMT 8.3V should be used alongside a consistent risk-management framework.
Traders should establish the following before entering a position:
- A clearly defined reason for entering.
- A predetermined invalidation level.
- An appropriate stop-loss location.
- A realistic profit objective.
- Position sizing consistent with account risk.
- A plan for managing unexpected volatility.
Limit orders may provide greater control over execution price, but they do not guarantee fills and may result in missed opportunities.
Market orders prioritize execution but may experience slippage, especially during volatile market conditions.
Neither execution method is universally superior.
The appropriate choice depends on the trading strategy, liquidity, volatility, and individual risk tolerance.
---
## 9. Markets and Trading Styles
AMT 8.3V is intended for use within technical-analysis workflows across a variety of liquid financial markets, including:
- Nasdaq futures (NQ / MNQ)
- S&P 500 futures (ES / MES)
- Gold futures (GC / MGC)
- Silver futures
- Forex
- Equity indices
- Stocks
- Cryptocurrency markets
The indicator's practical usefulness may vary depending on market characteristics, timeframe, available data, and the trader's execution methodology.
Auction-based concepts can be applied across different markets, but identical settings or trading rules should not be assumed to produce identical results.
---
## 10. The Importance of Patience and Discipline
One of the central ideas behind AMT 8.3V is that successful trading decisions require more than simply identifying a potential entry.
A trader must also determine whether the surrounding market environment supports the intended trade.
Not every movement requires participation.
Not every breakout deserves an entry.
Not every rejection indicates a reversal.
And not every technically valid setup offers an acceptable risk-to-reward opportunity.
AMT 8.3V is designed to encourage traders to prioritize market context, confirmation, and disciplined execution.
The objective is to develop a structured approach that can be evaluated, refined, and consistently applied over time.
---
## 11. Recommended Testing and Development
Before incorporating AMT 8.3V into live trading, users are encouraged to conduct historical testing and forward testing.
Important performance metrics include:
- Win rate.
- Average winning trade.
- Average losing trade.
- Average realized risk-to-reward ratio.
- Maximum drawdown.
- Profit factor.
- Performance across different market conditions.
- Execution costs, commissions, and slippage.
Historical results should not be treated as guarantees of future performance.
Forward testing in simulated market conditions can help traders evaluate how the indicator fits into their actual execution process.
A sufficiently large sample of trades is important when attempting to determine whether a strategy demonstrates a repeatable statistical advantage.
---
## 12. Final Thoughts
**AMT 8.3V is built around one central principle: understanding market behavior is more valuable than attempting to predict every price movement.**
Financial markets are dynamic environments in which buyers and sellers continuously respond to liquidity, perceived value, volatility, and changing expectations.
By incorporating Auction Market Theory, market structure, Volume Profile context, and additional confirmation tools, traders can develop a more organized approach to interpreting these conditions.
The purpose of AMT 8.3V is to support that process by encouraging context-driven analysis, patient execution, and disciplined risk management.
It is not intended to replace independent judgment or guarantee trading success.
**Trade the conditions, not the expectations.**
**Understand the auction. Respect the structure. Execute with discipline.**
---
### Disclaimer
AMT 8.3V is intended for educational and informational purposes only. It does not constitute financial advice, investment recommendations, or a guarantee of future results.
Trading futures, forex, equities, and other financial instruments involves substantial risk and may result in significant financial losses.
No indicator, strategy, or analytical framework can guarantee profitable trading outcomes.
Users are responsible for their own trading decisions, position sizing, and risk management.
Past performance is not indicative of future results.

免責聲明
這些資訊和出版物並非旨在提供,也不構成TradingView提供或認可的任何形式的財務、投資、交易或其他類型的建議或推薦。請閱讀使用條款以了解更多資訊。