Stochastic Radar Multi Time Frame [K & D]
hat tip © LonesomeTheBlue
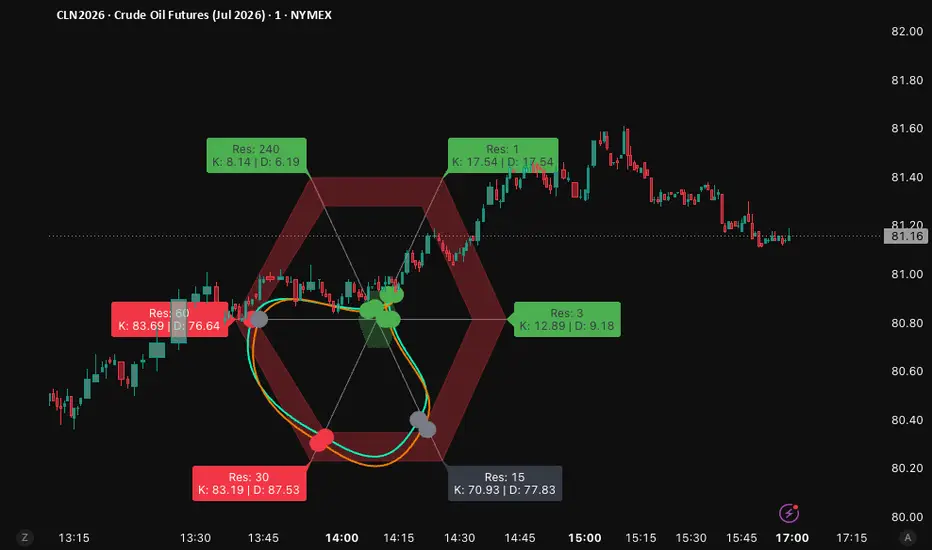
A multi-timeframe radar / spider chart that plots both %K and %D of the Stochastic Oscillator across 6 different timeframes simultaneously on one visual "hexagon" shape.
Blue line = %K
Orange line = %D
The shape expands/contracts based on the Stochastic values (higher = further from center)
Shaded zones show Overbought (red) and Oversold (green) areas
Labels show current K/D values + timeframe
Small circles mark the position of K and D
Main Features
Clean hexagonal radar layout
Separate %K and %D polylines
Independent toggles for labels and circles
Custom OB/OS levels
Works on any chart timeframe
Primary Use Cases
Quick Multi-Timeframe Momentum Overview
Instantly see if the asset is overbought/oversold across multiple timeframes at once (e.g. 1m, 5m, 15m, 1H, 4H, Daily).
Divergence & Alignment Detection
Great for spotting when %K and %D are diverging or when higher timeframes are embedded (strongly trending).
Confluence Trading
Traders look for situations where multiple arms are in extreme zones (e.g. all higher TFs showing Bull Embedded) before taking a position.
Scalping / Swing Trading Filter
Helps avoid counter-trend trades by showing when lower timeframes are fighting higher timeframes.
Best used when you want a fast visual "snapshot" of momentum alignment across timeframes without switching charts.
A multi-timeframe radar / spider chart that plots both %K and %D of the Stochastic Oscillator across 6 different timeframes simultaneously on one visual "hexagon" shape.
Blue line = %K
Orange line = %D
The shape expands/contracts based on the Stochastic values (higher = further from center)
Shaded zones show Overbought (red) and Oversold (green) areas
Labels show current K/D values + timeframe
Small circles mark the position of K and D
Main Features
Clean hexagonal radar layout
Separate %K and %D polylines
Independent toggles for labels and circles
Custom OB/OS levels
Works on any chart timeframe
Primary Use Cases
Quick Multi-Timeframe Momentum Overview
Instantly see if the asset is overbought/oversold across multiple timeframes at once (e.g. 1m, 5m, 15m, 1H, 4H, Daily).
Divergence & Alignment Detection
Great for spotting when %K and %D are diverging or when higher timeframes are embedded (strongly trending).
Confluence Trading
Traders look for situations where multiple arms are in extreme zones (e.g. all higher TFs showing Bull Embedded) before taking a position.
Scalping / Swing Trading Filter
Helps avoid counter-trend trades by showing when lower timeframes are fighting higher timeframes.
Best used when you want a fast visual "snapshot" of momentum alignment across timeframes without switching charts.

免責聲明
這些資訊和出版物並非旨在提供,也不構成TradingView提供或認可的任何形式的財務、投資、交易或其他類型的建議或推薦。請閱讀使用條款以了解更多資訊。
免責聲明
這些資訊和出版物並非旨在提供,也不構成TradingView提供或認可的任何形式的財務、投資、交易或其他類型的建議或推薦。請閱讀使用條款以了解更多資訊。