Kalman Velocity Ribbon [NovaLens]
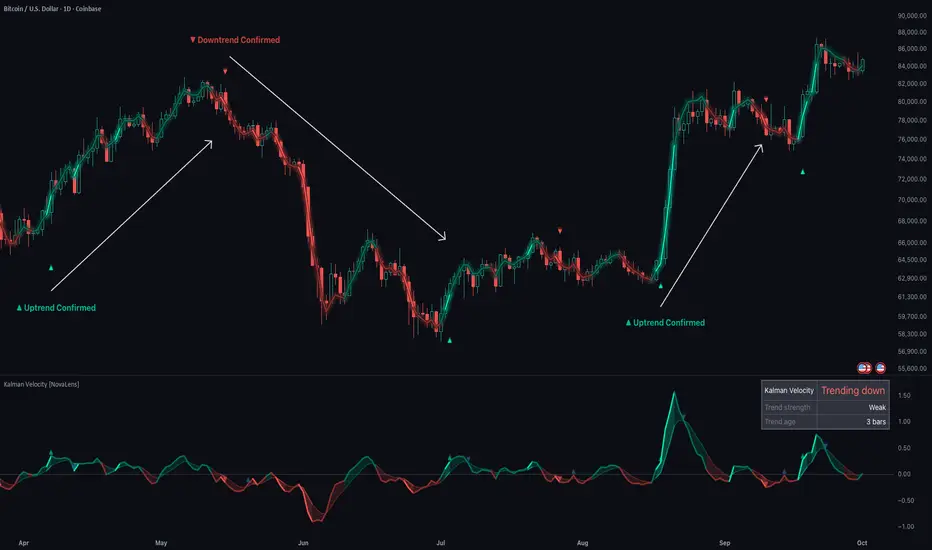
Kalman Velocity Ribbon tracks the trend and how fast it is moving, as two separate Kalman estimates rather than one smoothed line.
It uses that speed to show how strong a trend is, to mark the closed candle where a new trend is confirmed, and to say in plain words what the last candle shows.
Trends move in legs: the pace builds and eases, and the lower pane shows that pace candle by candle, without forecasting the turn. Many Kalman scripts stop at a smoothed line or an oscillator of the gap to price. Here the speed is the core of the tool: it colours the line by strength, it decides when a trend is confirmed, and it fills the ribbon in the lower pane. You get one answer at a glance: is there a trend, which way, and is it strong or weak. It describes the trend. It never tells you to buy or sell.
════════════════════════════════════════════
◉ HOW IT WORKS
Two estimates, not one line. A Kalman filter is a method from engineering for tracking something you can only measure with noise; Rudolf Kalman published it in 1960. Here it keeps two estimates of the trend: its price level (the line you see on the chart) and its velocity, the filter's own estimate of how fast the trend moves per candle. Velocity is kept separately from the line, so on a surprising close the line can step one way while velocity still points the other. On every close it predicts where the trend should be, compares that with the actual close, and corrects both estimates by how surprising the close was.
Calmer when the market is wild. The filter's noise settings follow volatility. When ATR rises above its own recent average, the filter trusts each single close less and follows more slowly. Big moves still move the line; it just leans less on any single close. When the market is quiet, it follows price more closely.
Speed in ATR, so every chart reads the same. Velocity is divided by the previous candle's ATR(14), the usual average true range (it counts gaps too). A reading of +0.15 means the filter estimates the trend moving up by 0.15 ATR per bar. That puts BTC, SPY and EURUSD on one scale, so the same strength tests mean the same thing everywhere.
What makes a trend strong. The line is bright only when all three tests pass on the candle:
If any test fails, the line dims. The panel's tooltip names the one that failed.
When a trend is confirmed. A ▲ prints on the first closed candle where velocity is above +0.15 ATR per bar and the close sits more than 0.3 ATR above the line, after the last confirmed downtrend. ▼ is the mirror. One mark per turn: no repeats while the trend holds, and nothing on the candle that is still forming.
════════════════════════════════════════════
◈ HOW TO READ IT
Colour first, then the triangles, then the panel.
The line on price.
The colour follows velocity, so after a sharp surprise the line can dip for a candle or two while it is still teal. Bright is strict on purpose. On BTCUSDT 1D about one candle in nine reads bright: it marks the candles where the push is clear, and dim is the normal state of a trend.
The triangles.
Triangles mark a confirmed trend, not the top or bottom: they wait until the closed-candle tests pass, so they usually print after the turn.
The ribbon (lower pane). The pane plots velocity in ATR per bar. Above zero velocity points up, below zero it points down, and the distance from zero is the speed. The ribbon is the band between velocity and its 5-bar average, in the line's colour, so you see at a glance whether the pace is running ahead of its recent average or falling behind it. Values are drawn within +/-5. Area and Columns styles are in the settings.
The Reading panel. Top right of the pane, always from the last closed candle:
The panel follows velocity's direction on every candle, while the triangles mark only confirmed turns, so the panel can read Trending up before a ▲ prints. Before there is a reading it shows Waiting, Warming up, No trend or No reading, with - in both rows.
════════════════════════════════════════════
✦ HOW WE USE IT: SPEED FIRST, THEN DIRECTION
BTCUSDT on the daily chart, January to June 2026, default settings:
Draining speed is not a turn: many fades recover and the trend carries on. The triangle is the part that tells you the other side has taken over, on a closed candle. Read the two together: the pane for the pace, the triangle for the confirmed change.
════════════════════════════════════════════
✦ OTHER APPLICATIONS
════════════════════════════════════════════
⚙ GETTING STARTED
Add it, leave Horizon on Auto, and read the colour. Auto picks the profile from your timeframe.
Horizon:
Signals: Show qualified trend marks on price (on); Show unconfirmed crosses on price, Show marks in the velocity pane, Show legacy event marks in the pane (all off).
Display: Show Reading panel, Theme (Auto, Dark, Light), Panel position (five spots; the TradingView logo can cover Bottom left), Pane style (Ribbon, Area, Columns), Glow, Show trend line on price.
Advanced (Custom only): Process Noise Min and Max, Observation Noise Min and Max. More process noise usually follows price faster; more observation noise usually smooths.
Appearance / Palette: Bullish strong, Bearish strong, Neutral, Unconfirmed cross, Bullish weak, Bearish weak.
Unconfirmed crosses (optional). Turn them on to see a small blue triangle where price has already closed more than 0.3 ATR past the line while velocity has not turned yet (still zero or pointing the other way), inside a confirmed trend the other way. Price moved first; a confirmed trend may or may not follow. Once per swing.
════════════════════════════════════════════
△ LIMITATIONS
════════════════════════════════════════════
🔔 ALERTS
Pick a condition in TradingView's alert dialog (needs a plan with indicator alerts). Each fires once on a confirmed close, never on the live candle, whether the marks are shown or hidden.
On BINANCE:BTCUSDT 1D, 3,331 closed candles since August 2017, they fired 78, 78, 48 and 51 times, in list order. Observed there, not a promise.
Message: AK-01 | event | ticker | interval | close | bar time | confirmed on bar close.
════════════════════════════════════════════
⌁ NOTES
NovaLens
It uses that speed to show how strong a trend is, to mark the closed candle where a new trend is confirmed, and to say in plain words what the last candle shows.
Trends move in legs: the pace builds and eases, and the lower pane shows that pace candle by candle, without forecasting the turn. Many Kalman scripts stop at a smoothed line or an oscillator of the gap to price. Here the speed is the core of the tool: it colours the line by strength, it decides when a trend is confirmed, and it fills the ribbon in the lower pane. You get one answer at a glance: is there a trend, which way, and is it strong or weak. It describes the trend. It never tells you to buy or sell.
════════════════════════════════════════════
◉ HOW IT WORKS
Two estimates, not one line. A Kalman filter is a method from engineering for tracking something you can only measure with noise; Rudolf Kalman published it in 1960. Here it keeps two estimates of the trend: its price level (the line you see on the chart) and its velocity, the filter's own estimate of how fast the trend moves per candle. Velocity is kept separately from the line, so on a surprising close the line can step one way while velocity still points the other. On every close it predicts where the trend should be, compares that with the actual close, and corrects both estimates by how surprising the close was.
Calmer when the market is wild. The filter's noise settings follow volatility. When ATR rises above its own recent average, the filter trusts each single close less and follows more slowly. Big moves still move the line; it just leans less on any single close. When the market is quiet, it follows price more closely.
Speed in ATR, so every chart reads the same. Velocity is divided by the previous candle's ATR(14), the usual average true range (it counts gaps too). A reading of +0.15 means the filter estimates the trend moving up by 0.15 ATR per bar. That puts BTC, SPY and EURUSD on one scale, so the same strength tests mean the same thing everywhere.
What makes a trend strong. The line is bright only when all three tests pass on the candle:
- It moves clearly - velocity is beyond 0.15 ATR per bar.
- Price agrees - the close is more than 0.3 ATR past the line, on the side velocity points.
- It is not running out of steam - the speed has not shrunk three closes in a row.
If any test fails, the line dims. The panel's tooltip names the one that failed.
When a trend is confirmed. A ▲ prints on the first closed candle where velocity is above +0.15 ATR per bar and the close sits more than 0.3 ATR above the line, after the last confirmed downtrend. ▼ is the mirror. One mark per turn: no repeats while the trend holds, and nothing on the candle that is still forming.
════════════════════════════════════════════
◈ HOW TO READ IT
Colour first, then the triangles, then the panel.
The line on price.
- Bright teal = strong uptrend - velocity points up clearly, price is well above the line, and the speed has not shrunk three closes in a row.
- Dim teal = weak uptrend - still up, but slow, or price is not clearly above the line, or the speed keeps shrinking.
- Bright red / dim red - the same reads for a downtrend.
- Grey = no reading - warm-up, bad data, or velocity of exactly zero. Grey is not a flat trend.
The colour follows velocity, so after a sharp surprise the line can dip for a candle or two while it is still teal. Bright is strict on purpose. On BTCUSDT 1D about one candle in nine reads bright: it marks the candles where the push is clear, and dim is the normal state of a trend.
The triangles.
- ▲ Uptrend Confirmed - below the candle that confirmed a new uptrend.
- ▼ Downtrend Confirmed - above the candle that confirmed a new downtrend.
- Hover a triangle for its date, the speed at that close and why it printed.
Triangles mark a confirmed trend, not the top or bottom: they wait until the closed-candle tests pass, so they usually print after the turn.
The ribbon (lower pane). The pane plots velocity in ATR per bar. Above zero velocity points up, below zero it points down, and the distance from zero is the speed. The ribbon is the band between velocity and its 5-bar average, in the line's colour, so you see at a glance whether the pace is running ahead of its recent average or falling behind it. Values are drawn within +/-5. Area and Columns styles are in the settings.
The Reading panel. Top right of the pane, always from the last closed candle:
- Kalman Velocity: Trending up / Trending down - which way velocity points, in teal or red.
- Trend strength: Strong / Weak - Strong when all three tests pass. Hover Weak to see which test failed.
- Trend age - how many closed candles in a row velocity has pointed the same way.
The panel follows velocity's direction on every candle, while the triangles mark only confirmed turns, so the panel can read Trending up before a ▲ prints. Before there is a reading it shows Waiting, Warming up, No trend or No reading, with - in both rows.
════════════════════════════════════════════
✦ HOW WE USE IT: SPEED FIRST, THEN DIRECTION
BTCUSDT on the daily chart, January to June 2026, default settings:
- 14 to 17 January. Price is still above 95,000 and the line is still teal, but the pane shows the speed draining from +0.66 to +0.05 ATR per bar in four candles. The trend is losing its push before it changes direction.
- 18 January: ▼ Downtrend Confirmed at a close near 93,700.
- Late January to 5 February. Apart from two teal days in late January, the line stays red down to the 5 February close near 62,900, bright on the hardest down days and dim in between. The pane reaches -1.11 ATR per bar on 5 February, its fastest fall of the move.
- 6 February to 31 March. Velocity stays between about -0.48 and +0.44 ATR per bar, and the line flips between teal and red every few days, mostly dim. That is the tool saying there is no clean trend. A ▲ (2 March) and a ▼ (27 March) print in this stretch, and each time the line turned the other way within four days.
- 7 April: ▲ Uptrend Confirmed at a close near 71,900, with the pane at +0.47. The line stays mostly teal as price climbs to 82,000 in May.
- 22 May: ▼ Downtrend Confirmed, and the line turns bright red on the early June drop below 65,000.
Draining speed is not a turn: many fades recover and the trend carries on. The triangle is the part that tells you the other side has taken over, on a closed candle. Read the two together: the pane for the pace, the triangle for the confirmed change.
════════════════════════════════════════════
✦ OTHER APPLICATIONS
- Trend context for another system - check the panel's direction and strength before you read another tool's signal, so you know whether it comes with a strong trend, a weak one or none.
- Range spotting - frequent colour flips, a mostly dim line and a ribbon hugging zero describe a market without a clean trend.
- Fading watch - a long Trend age with Weak strength and a shrinking speed describes a trend that is still running but losing its push.
- Alert-driven workflow - subscribe to the confirmed trend alerts and look at the chart only when a new trend is confirmed.
════════════════════════════════════════════
⚙ GETTING STARTED
Add it, leave Horizon on Auto, and read the colour. Auto picks the profile from your timeframe.
Horizon:
- Auto (default) - Intraday below 4h, Swing from 4h through 1D, Position above 1D.
- Intraday reacts fastest, Swing is balanced, Position is the slowest.
- Custom - unlocks ATR Period and Volatility Sensitivity, and the Advanced noise settings.
Signals: Show qualified trend marks on price (on); Show unconfirmed crosses on price, Show marks in the velocity pane, Show legacy event marks in the pane (all off).
Display: Show Reading panel, Theme (Auto, Dark, Light), Panel position (five spots; the TradingView logo can cover Bottom left), Pane style (Ribbon, Area, Columns), Glow, Show trend line on price.
Advanced (Custom only): Process Noise Min and Max, Observation Noise Min and Max. More process noise usually follows price faster; more observation noise usually smooths.
Appearance / Palette: Bullish strong, Bearish strong, Neutral, Unconfirmed cross, Bullish weak, Bearish weak.
Unconfirmed crosses (optional). Turn them on to see a small blue triangle where price has already closed more than 0.3 ATR past the line while velocity has not turned yet (still zero or pointing the other way), inside a confirmed trend the other way. Price moved first; a confirmed trend may or may not follow. Once per swing.
════════════════════════════════════════════
△ LIMITATIONS
- Descriptive, not predictive - it shows the trend's direction, speed and strength on closed candles. It makes no claim about the next candle and has no buy or sell signal.
- Confirmed-bar - the line, glow and pane can change before the candle closes; the panel, triangles and alerts wait for the close.
- Triangles lag the turn - they wait for the closed-candle tests, so they usually print after the top or bottom, and a confirmed trend can reverse within a few candles.
- Easy to miss in busy charts - in crowded candles a triangle can be slow to spot or may not clearly mark its candle; hover it for the date.
- Label limit - turning on a second mark type can drop older price triangles (TradingView's label limit); alerts stay the same.
- Panel placement - the panel can cover recent pane values; move it with Panel position.
- Warm-up - 4 x ATR length - 1 candles (55 on Swing, at least 15). A missing close ends readings from there. Heikin Ashi and Renko charts show No reading.
- Presets - picked on 2025 SPY, BTCUSDT and EURUSD data (1D and 4h).
════════════════════════════════════════════
🔔 ALERTS
Pick a condition in TradingView's alert dialog (needs a plan with indicator alerts). Each fires once on a confirmed close, never on the live candle, whether the marks are shown or hidden.
- Qualified Trend Up (Once Per Bar Close) - the ▲ rule; once per turn.
- Qualified Trend Down (Once Per Bar Close) - the ▼ rule.
- Unconfirmed Cross Up (Once Per Bar Close) - inside a confirmed downtrend, a close more than 0.3 ATR above the line while velocity is still zero or negative, after a clear close below it; once per swing.
- Unconfirmed Cross Down (Once Per Bar Close) - the mirror.
On BINANCE:BTCUSDT 1D, 3,331 closed candles since August 2017, they fired 78, 78, 48 and 51 times, in list order. Observed there, not a promise.
Message: AK-01 | event | ticker | interval | close | bar time | confirmed on bar close.
════════════════════════════════════════════
⌁ NOTES
- Method: a constant-velocity Kalman filter with ATR-adaptive process and observation noise. NovaLens adds the Horizon profiles, the strength colours, the confirmed trend marks, the Reading panel, the tooltips and the alerts.
- Reference: R. E. Kalman, A New Approach to Linear Filtering and Prediction Problems, Journal of Basic Engineering (1960).
- Repaint: Confirmed-bar. The panel, triangles and alerts use confirmed closes only; the line, glow and pane update on the live candle.
- Open-source under MPL 2.0. Free to use, fork, study.
NovaLens

Systematic indicators and strategies from real quant research, designed for a cleaner market view.
🟢 Join our research list: novalens.io
Not financial advice. Always do your own research.
🟢 Join our research list: novalens.io
Not financial advice. Always do your own research.
免責聲明
這些資訊和出版物並非旨在提供,也不構成TradingView提供或認可的任何形式的財務、投資、交易或其他類型的建議或推薦。請閱讀使用條款以了解更多資訊。
Systematic indicators and strategies from real quant research, designed for a cleaner market view.
🟢 Join our research list: novalens.io
Not financial advice. Always do your own research.
🟢 Join our research list: novalens.io
Not financial advice. Always do your own research.
免責聲明
這些資訊和出版物並非旨在提供,也不構成TradingView提供或認可的任何形式的財務、投資、交易或其他類型的建議或推薦。請閱讀使用條款以了解更多資訊。