ARI-WMA Oscillator
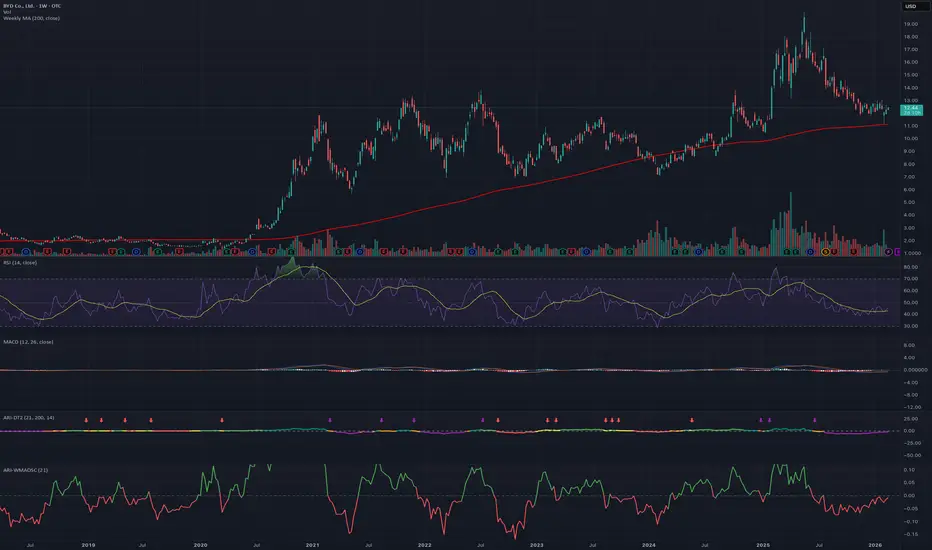
ARI-20WMA Oscillator is a momentum-based technical indicator that measures the deviation of the current price from a 20-period weighted moving average on a weekly timeframe. By calculating the logarithmic ratio between price and the MA, it identifies overbought and oversold conditions while smoothing out noise.
How it works:
The oscillator plots the log10 ratio of the close price to a 20-period simple moving average. Values above zero indicate bullish momentum (price trading above the MA), while values below zero signal bearish momentum (price trading below the MA). The colour coding—green for bullish, red for bearish, and orange for neutral—makes it easy to spot trend direction at a glance.
Use cases:
Identify potential reversal points when the oscillator reaches extreme levels
Confirm trend strength and momentum
Generate trading signals when crossing the zero line
Screen for stocks breaking key moving average levels
Settings:
Period: Adjustable MA period (default 21)
Use Weekly MA: Toggle between weekly and current timeframe calculations for flexibility across different trading styles
Best used in conjunction with price action and other confirmation indicators.
How it works:
The oscillator plots the log10 ratio of the close price to a 20-period simple moving average. Values above zero indicate bullish momentum (price trading above the MA), while values below zero signal bearish momentum (price trading below the MA). The colour coding—green for bullish, red for bearish, and orange for neutral—makes it easy to spot trend direction at a glance.
Use cases:
Identify potential reversal points when the oscillator reaches extreme levels
Confirm trend strength and momentum
Generate trading signals when crossing the zero line
Screen for stocks breaking key moving average levels
Settings:
Period: Adjustable MA period (default 21)
Use Weekly MA: Toggle between weekly and current timeframe calculations for flexibility across different trading styles
Best used in conjunction with price action and other confirmation indicators.

免責聲明
這些資訊和出版物並非旨在提供,也不構成TradingView提供或認可的任何形式的財務、投資、交易或其他類型的建議或推薦。請閱讀使用條款以了解更多資訊。
免責聲明
這些資訊和出版物並非旨在提供,也不構成TradingView提供或認可的任何形式的財務、投資、交易或其他類型的建議或推薦。請閱讀使用條款以了解更多資訊。