OPEN-SOURCE SCRIPT
Stoch RSI - (Crossover Visual Upgrade)
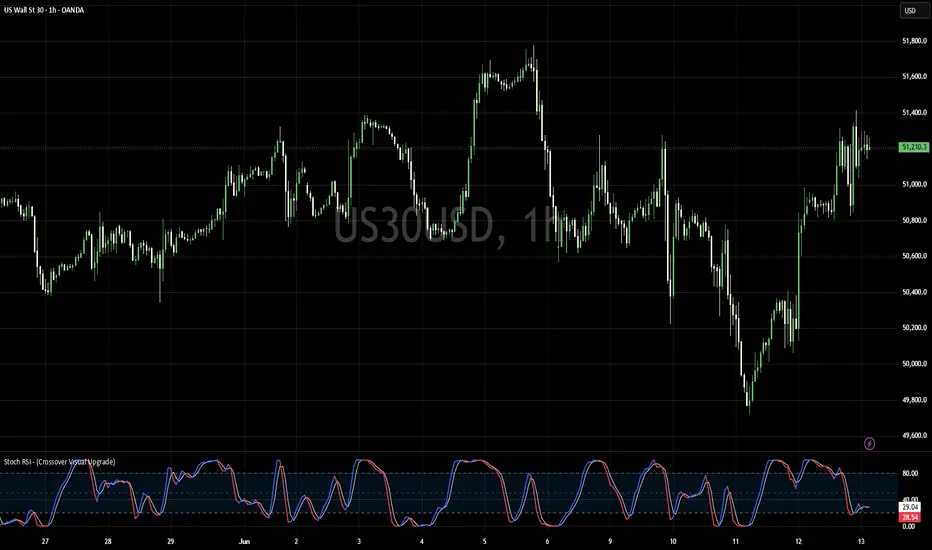
Stochastic RSI (Crossover Visual Upgrade) - Enhanced Momentum Indicator
This script is an optimized version of the standard Stochastic RSI. While maintaining the familiar logic of the original indicator, I have introduced a dynamic color-coding system for the K-line to help traders instantly identify momentum shifts and crossovers.
Why this version is useful:
In fast-paced markets, distinguishing between bullish and bearish momentum on a standard Stochastic RSI can be difficult. This version simplifies the process by automatically changing the color of the Fast K-line:
Blue: Indicates the Fast line (K) is above the Slow line (D), signaling potential bullish momentum.
Red: Indicates the Fast line (K) is below the Slow line (D), signaling potential bearish momentum.
This visual upgrade helps reduce eye strain and allows you to make quicker trading decisions without needing to closely track line overlaps.
Key Features:
Dynamic Color-Coding: Real-time color updates for the K-line based on its position relative to the D-line.
Clean Visuals: Retains the classic bands and structure while improving readability for day trading.
Lightweight & Efficient: Optimized for performance so it won't clutter your chart.
How to use:
Simply add the indicator to your chart. The Fast K-line will change color dynamically as it crosses the Slow D-line, giving you an immediate visual confirmation of the current momentum direction.
Author's Note:
I created this visual upgrade because I prefer a cleaner look when monitoring stochastic crossovers during fast trades. I wanted to remove the guesswork when glancing at the indicator. Since I found it very helpful for my own setup, I decided to share it with the community. Big thanks to Gemini for helping me craft this description. I hope you find this useful!
This script is an optimized version of the standard Stochastic RSI. While maintaining the familiar logic of the original indicator, I have introduced a dynamic color-coding system for the K-line to help traders instantly identify momentum shifts and crossovers.
Why this version is useful:
In fast-paced markets, distinguishing between bullish and bearish momentum on a standard Stochastic RSI can be difficult. This version simplifies the process by automatically changing the color of the Fast K-line:
Blue: Indicates the Fast line (K) is above the Slow line (D), signaling potential bullish momentum.
Red: Indicates the Fast line (K) is below the Slow line (D), signaling potential bearish momentum.
This visual upgrade helps reduce eye strain and allows you to make quicker trading decisions without needing to closely track line overlaps.
Key Features:
Dynamic Color-Coding: Real-time color updates for the K-line based on its position relative to the D-line.
Clean Visuals: Retains the classic bands and structure while improving readability for day trading.
Lightweight & Efficient: Optimized for performance so it won't clutter your chart.
How to use:
Simply add the indicator to your chart. The Fast K-line will change color dynamically as it crosses the Slow D-line, giving you an immediate visual confirmation of the current momentum direction.
Author's Note:
I created this visual upgrade because I prefer a cleaner look when monitoring stochastic crossovers during fast trades. I wanted to remove the guesswork when glancing at the indicator. Since I found it very helpful for my own setup, I decided to share it with the community. Big thanks to Gemini for helping me craft this description. I hope you find this useful!
開源腳本
秉持TradingView一貫精神,這個腳本的創作者將其設為開源,以便交易者檢視並驗證其功能。向作者致敬!您可以免費使用此腳本,但請注意,重新發佈代碼需遵守我們的社群規範。

免責聲明
這些資訊和出版物並非旨在提供,也不構成TradingView提供或認可的任何形式的財務、投資、交易或其他類型的建議或推薦。請閱讀使用條款以了解更多資訊。
開源腳本
秉持TradingView一貫精神,這個腳本的創作者將其設為開源,以便交易者檢視並驗證其功能。向作者致敬!您可以免費使用此腳本,但請注意,重新發佈代碼需遵守我們的社群規範。
免責聲明
這些資訊和出版物並非旨在提供,也不構成TradingView提供或認可的任何形式的財務、投資、交易或其他類型的建議或推薦。請閱讀使用條款以了解更多資訊。