Seasonality vs Shuffled Calendar: Is the Best Month Real?
WHAT IT DOES
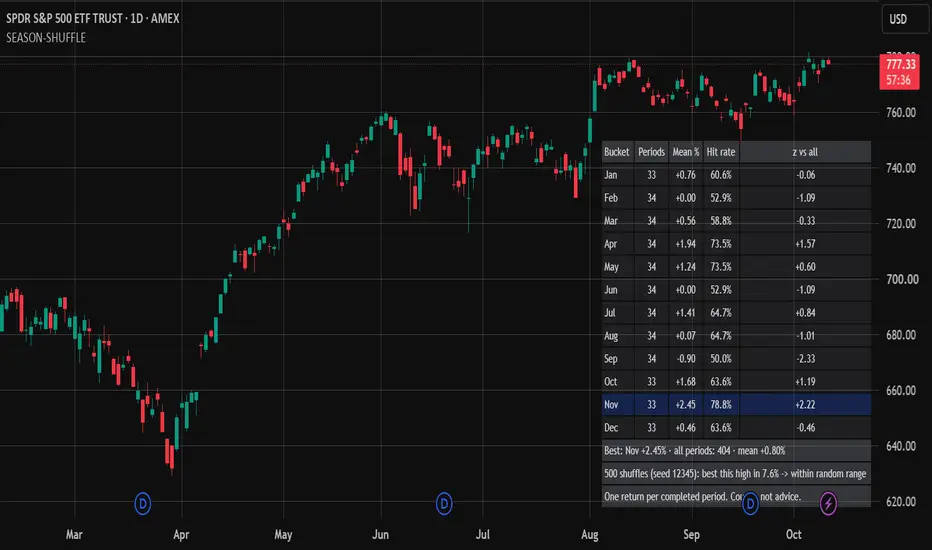
Seasonality Shuffle builds a seasonality board for the chart, by month of the year or by day of the week, and tests its best row against a shuffled calendar. For every bucket the table shows the number of completed periods, the mean return, the hit rate (share of periods with a positive return) and a z-score of the bucket mean against the mean of all periods. Footer rows give the best bucket, the shuffled-calendar result and a plain verdict.
WHAT IS ORIGINAL HERE
Any seasonality table has a highest row, even when the returns are pure noise: with 12 months, one of them has to come first. The useful question is whether the best bucket is higher than a random calendar would give. The script keeps the real return of every completed period and reassigns those returns to buckets at random, many times. The returns and the number of periods per bucket stay exactly as they are; only the calendar labels move. Each shuffle records its own best bucket mean. The share of shuffles that reach the observed best is an empirical p-value for "the best bucket", not for one bucket picked in advance, so the choice among 12 (or 7) candidates is already counted. The generator is deterministic with a seed you set, so the number is repeatable.
HOW THE TEST WORKS
1. The chart is split into calendar periods: one per month in Month of year mode, one per day in Day of week mode. A period's return is the close of its last bar divided by the close of the previous period's last bar, minus 1. The first, partial period and the current, unfinished one are not counted.
2. Each return gets a label: the calendar month (Jan to Dec) or the weekday (Sun to Sat).
3. Per bucket: n, mean, hit rate and z = (bucket mean - mean of all periods) / (sample standard deviation of all periods / square root of n). The z needs the minimum number of periods you set; below it the cell reads "few".
4. The best bucket is the one with the highest mean, among buckets with at least one period.
5. The labels are shuffled at random (Fisher-Yates), the returns stay put, and the best bucket mean is recomputed. This repeats for the number of runs you choose.
6. p = (runs that reach the observed best + 1) / (runs + 1). A p below 0.05 reads "unlikely to be chance"; otherwise "within random range". With fewer periods than twice the number of buckets, the test is not run: "too few periods".
HOW TO USE IT
1. Add it to a chart with as much history as your plan loads. Use a timeframe shorter than the period: daily or lower for months, intraday or daily for days.
2. Choose the buckets: Month of year or Day of week.
3. Choose the number of shuffled calendars (50 to 2000), the seed and the minimum periods per bucket for a z-score.
Every symbol, timeframe and mode you try is another look at the data.
HOW TO READ THE TABLE
Bucket: the month or the weekday. The highlighted row is the best bucket.
Periods: completed periods in that bucket. "-" means none.
Mean %: mean return per period, in percent.
Hit rate: share of periods with a return above zero.
z vs all: distance between the bucket mean and the mean of all periods, in standard errors. "few" means fewer periods than the minimum.
Footer 1: the best bucket, the number of periods and the mean of all periods.
Footer 2: how often a shuffled calendar produced a best bucket at least as good, and the verdict. Green means "unlikely to be chance".
LIMITATIONS
The test treats periods as interchangeable. It ignores trends, volatility clustering and any link between one period and the next, which shuffled labels do not preserve.
It tests the highest mean only, not the worst bucket, the ranking, or a month chosen before looking at the data.
The z-score is descriptive; the p-value does not depend on it.
About 1 test in 20 reads "unlikely to be chance" when there is no seasonality at all, and no correction is applied across symbols, timeframes or modes.
Only bars loaded on the chart count, so history depth and timeframe change the number of periods. A period is counted once the first bar of the next period has closed. Day of week mode uses calendar days in the exchange time zone.
Many runs on a long history in Day of week mode are heavy; lower the runs if TradingView reports a runtime limit.
The script reports counts and a permutation test on past data, not a forecast or a trading rule, and it is not financial advice.
The chart shows SPY on the daily timeframe with the default settings. The table is in the bottom right.
Seasonality Shuffle builds a seasonality board for the chart, by month of the year or by day of the week, and tests its best row against a shuffled calendar. For every bucket the table shows the number of completed periods, the mean return, the hit rate (share of periods with a positive return) and a z-score of the bucket mean against the mean of all periods. Footer rows give the best bucket, the shuffled-calendar result and a plain verdict.
WHAT IS ORIGINAL HERE
Any seasonality table has a highest row, even when the returns are pure noise: with 12 months, one of them has to come first. The useful question is whether the best bucket is higher than a random calendar would give. The script keeps the real return of every completed period and reassigns those returns to buckets at random, many times. The returns and the number of periods per bucket stay exactly as they are; only the calendar labels move. Each shuffle records its own best bucket mean. The share of shuffles that reach the observed best is an empirical p-value for "the best bucket", not for one bucket picked in advance, so the choice among 12 (or 7) candidates is already counted. The generator is deterministic with a seed you set, so the number is repeatable.
HOW THE TEST WORKS
1. The chart is split into calendar periods: one per month in Month of year mode, one per day in Day of week mode. A period's return is the close of its last bar divided by the close of the previous period's last bar, minus 1. The first, partial period and the current, unfinished one are not counted.
2. Each return gets a label: the calendar month (Jan to Dec) or the weekday (Sun to Sat).
3. Per bucket: n, mean, hit rate and z = (bucket mean - mean of all periods) / (sample standard deviation of all periods / square root of n). The z needs the minimum number of periods you set; below it the cell reads "few".
4. The best bucket is the one with the highest mean, among buckets with at least one period.
5. The labels are shuffled at random (Fisher-Yates), the returns stay put, and the best bucket mean is recomputed. This repeats for the number of runs you choose.
6. p = (runs that reach the observed best + 1) / (runs + 1). A p below 0.05 reads "unlikely to be chance"; otherwise "within random range". With fewer periods than twice the number of buckets, the test is not run: "too few periods".
HOW TO USE IT
1. Add it to a chart with as much history as your plan loads. Use a timeframe shorter than the period: daily or lower for months, intraday or daily for days.
2. Choose the buckets: Month of year or Day of week.
3. Choose the number of shuffled calendars (50 to 2000), the seed and the minimum periods per bucket for a z-score.
Every symbol, timeframe and mode you try is another look at the data.
HOW TO READ THE TABLE
Bucket: the month or the weekday. The highlighted row is the best bucket.
Periods: completed periods in that bucket. "-" means none.
Mean %: mean return per period, in percent.
Hit rate: share of periods with a return above zero.
z vs all: distance between the bucket mean and the mean of all periods, in standard errors. "few" means fewer periods than the minimum.
Footer 1: the best bucket, the number of periods and the mean of all periods.
Footer 2: how often a shuffled calendar produced a best bucket at least as good, and the verdict. Green means "unlikely to be chance".
LIMITATIONS
The test treats periods as interchangeable. It ignores trends, volatility clustering and any link between one period and the next, which shuffled labels do not preserve.
It tests the highest mean only, not the worst bucket, the ranking, or a month chosen before looking at the data.
The z-score is descriptive; the p-value does not depend on it.
About 1 test in 20 reads "unlikely to be chance" when there is no seasonality at all, and no correction is applied across symbols, timeframes or modes.
Only bars loaded on the chart count, so history depth and timeframe change the number of periods. A period is counted once the first bar of the next period has closed. Day of week mode uses calendar days in the exchange time zone.
Many runs on a long history in Day of week mode are heavy; lower the runs if TradingView reports a runtime limit.
The script reports counts and a permutation test on past data, not a forecast or a trading rule, and it is not financial advice.
The chart shows SPY on the daily timeframe with the default settings. The table is in the bottom right.

Custom Pine Script v6: indicators, strategies, alerts, with look-ahead and repaint checks. Backtest audits in Python.
Hire me on Upwork: upwork.com/freelancers/~01fa3c5136b53674c8
Proofs on GitHub: github.com/guillemustafa-ux
Hire me on Upwork: upwork.com/freelancers/~01fa3c5136b53674c8
Proofs on GitHub: github.com/guillemustafa-ux
免責聲明
這些資訊和出版物並非旨在提供,也不構成TradingView提供或認可的任何形式的財務、投資、交易或其他類型的建議或推薦。請閱讀使用條款以了解更多資訊。
Custom Pine Script v6: indicators, strategies, alerts, with look-ahead and repaint checks. Backtest audits in Python.
Hire me on Upwork: upwork.com/freelancers/~01fa3c5136b53674c8
Proofs on GitHub: github.com/guillemustafa-ux
Hire me on Upwork: upwork.com/freelancers/~01fa3c5136b53674c8
Proofs on GitHub: github.com/guillemustafa-ux
免責聲明
這些資訊和出版物並非旨在提供,也不構成TradingView提供或認可的任何形式的財務、投資、交易或其他類型的建議或推薦。請閱讀使用條款以了解更多資訊。