OPEN-SOURCE SCRIPT
Long Wick Detector
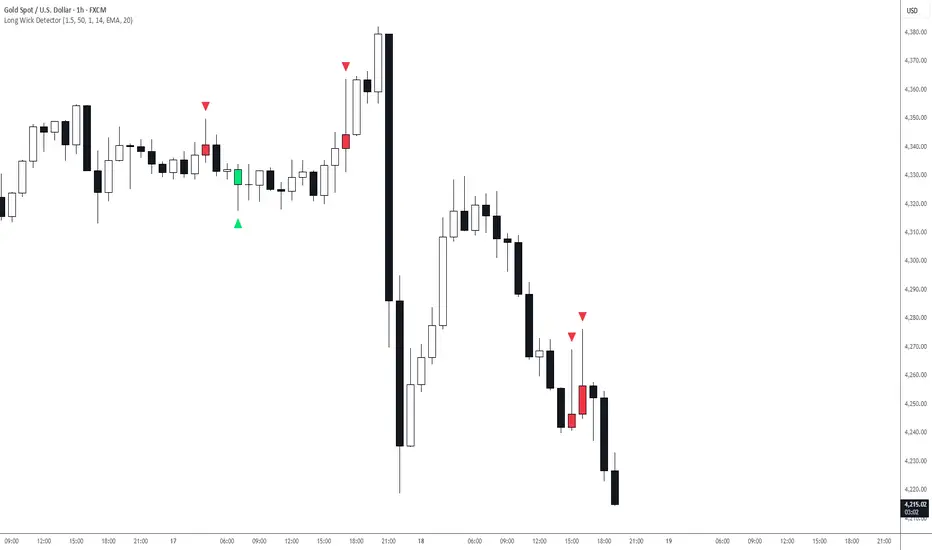
This indicator is for traders who want a simple quick way to spot long-wick candle.
The Long Wick Detector is a simple candlestick-based indicator designed to highlight candles with long upper or lower wicks. These candles often represent strong rejection from a price level and may appear near potential reversal areas, support/resistance zones, liquidity sweeps, or exhaustion points.
The indicator marks:
- Long Upper Wicks with a red downward triangle above the candle
- Long Lower Wicks with a green upward triangle below the candle
It can also optionally color the candle red or green when a valid signal appears.
How It Works
This indicator checks each candle using three main filters:
1. Wick Size Compared to Body
The script compares the wick size to the candle body.
For example, if the setting is:
Wick >= 1.4 × Body
then the wick must be at least 1.4 times larger than the candle body to qualify.
This helps identify candles where rejection is meaningfully larger than the body.
2. Wick Percentage of Total Candle Range
The script also checks how much of the total candle range is made up by the wick.
For example, if the setting is:
Minimum Wick % of Candle Range = 50%
then the wick must represent at least half of the full candle range from high to low.
This helps filter out candles where the wick is large compared to the body but still not dominant in the full candle structure.
3. ATR-Based Candle Range Filter
The script uses ATR to make sure the candle range is significant relative to recent volatility. This helps avoid weak or insignificant candles during low-volatility periods.
For example, if the setting is:
Minimum Candle Range = ATR × 1.1
then the candle’s total range must be at least 1.1 times the current ATR value.
Trend Bias Filter
The indicator includes an optional Preceding Trend Bias Filter.
When enabled, the script only shows signals that appear after a directional move:
- A long upper wick is shown only after a preceding uptrend
- A long lower wick is shown only after a preceding downtrend
This makes the indicator more focused on potential reversal-style wick signals.
The trend bias can be calculated using one of three methods:
EMA
Uses an Exponential Moving Average.
- Previous close above the EMA = uptrend
- Previous close below the EMA = downtrend
SMA
Uses a Simple Moving Average.
- Previous close above the SMA = uptrend
- Previous close below the SMA = downtrend
Price Action
Compares the previous candle close to the close from the selected lookback length.
- Previous close above the close from N bars ago = uptrend
- Previous close below the close from N bars ago = downtrend
Signal Meaning
Red Down Triangle — Long Upper Wick
A red downward triangle above the candle means the candle has a significant upper wick.
This may suggest that price pushed higher but was rejected before the candle closed. Traders often interpret this as possible selling pressure, especially near resistance, supply zones, previous highs, or after an extended upward move.
Green Up Triangle — Long Lower Wick
A green upward triangle below the candle means the candle has a significant lower wick.
This may suggest that price pushed lower but was rejected before the candle closed. Traders often interpret this as possible buying pressure, especially near support, demand zones, previous lows, or after an extended downward move.
Recommended Use
This indicator is best used as a confirmation or filtering tool, not as a standalone trading system.
It may be useful for identifying:
- Potential reversal candles
- Liquidity grabs or stop hunts
- Rejection from support or resistance
- Exhaustion candles after strong moves
- Possible entry confirmation near key levels
For stronger analysis, consider combining it with:
- Support and resistance
- Trend structure
- Market sessions
- Higher-timeframe bias
- Volume
- Risk management rules
Input Settings
Wick >= X × Body
Controls how much larger the wick must be compared to the candle body.
Higher values produce fewer but stricter signals.
Minimum Wick % of Candle Range
Controls the minimum percentage of the full candle range that must be made up by the wick.
Higher values require the wick to dominate more of the candle.
Minimum Candle Range = ATR ×
Controls how large the full candle must be compared to ATR.
Higher values filter out smaller candles and show only stronger volatility candles.
ATR Length
Controls the ATR calculation period.
A common default is 14.
Require Preceding Trend Bias
When enabled, signals must appear after a preceding directional trend.
When disabled, the indicator will detect long wick candles regardless of prior trend direction.
Bias Definition Method
Controls how the script defines the preceding trend.
Options:
- EMA
- SMA
- Price Action
Lookback Length for Bias
Controls the moving average length or price action comparison length used for the trend bias filter.
Alerts
The script includes alert conditions for both signal types:
- Long Upper Wick detected
- Long Lower Wick detected
Users can create TradingView alerts from the indicator to receive notifications when either condition appears.
Important Note
A long wick does not guarantee a reversal. It only shows that price was rejected from part of the candle’s range.
Signals should be confirmed with market context, structure and proper risk management.
This indicator does not provide financial advice and should be used for educational and analytical purposes only.
開源腳本
秉持TradingView一貫精神,這個腳本的創作者將其設為開源,以便交易者檢視並驗證其功能。向作者致敬!您可以免費使用此腳本,但請注意,重新發佈代碼需遵守我們的社群規範。

免責聲明
這些資訊和出版物並非旨在提供,也不構成TradingView提供或認可的任何形式的財務、投資、交易或其他類型的建議或推薦。請閱讀使用條款以了解更多資訊。
開源腳本
秉持TradingView一貫精神,這個腳本的創作者將其設為開源,以便交易者檢視並驗證其功能。向作者致敬!您可以免費使用此腳本,但請注意,重新發佈代碼需遵守我們的社群規範。
免責聲明
這些資訊和出版物並非旨在提供,也不構成TradingView提供或認可的任何形式的財務、投資、交易或其他類型的建議或推薦。請閱讀使用條款以了解更多資訊。