OPEN-SOURCE SCRIPT
已更新 HTF Candle Clusters - Multi-Timeframe PO3 Overlay
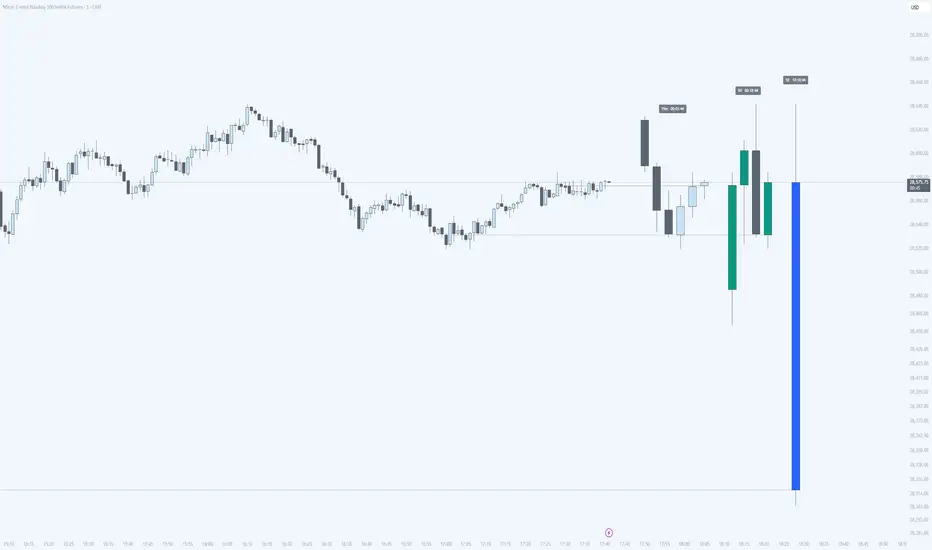
HTF Candle Clusters is a configurable multi-timeframe overlay that projects up to three higher-timeframe candle groups beside the live chart.
The indicator helps traders read higher-timeframe structure without leaving their execution timeframe. It provides a compact visual framework for HTF candle analysis, PO3 candle analysis, and discretionary Power of Three workflows.
KEY FEATURES
- Display up to three independent HTF candle clusters.
- Configure the timeframe and number of candles for each cluster.
- Use manual timeframes or enable Auto Mode to select suitable higher timeframes from the current chart timeframe.
- View the developing current HTF candle alongside completed HTF candles.
- Draw the current HTF open from its actual opening time to the projected current candle.
- Display the previous HTF candle midpoint when enabled.
- Show a live countdown for the current candle in each cluster.
- Combine the timeframe and countdown in a clean label positioned above the highest candle in the cluster.
- Customize bullish and bearish bodies, wicks, borders, open lines, midpoint lines, widths, colors, and line styles.
- Adjust candle width, candle spacing, cluster spacing, and right-side offset.
DEFAULT CONFIGURATION
- Auto Mode: enabled.
- Cluster 1: 15-minute timeframe, 6 candles.
- Cluster 2: 1-hour timeframe, 4 candles.
- Cluster 3: 1-day timeframe, 1 candle.
- Current HTF open lines: enabled with dotted style.
- Previous HTF midpoint lines: disabled by default and available per cluster.
- Countdown labels: enabled.
PO3 AND POWER OF THREE USE
PO3 traders can use the projected HTF candles to monitor the current higher-timeframe open, candle range, optional previous midpoint, and time remaining before the candle closes.
This indicator does not automatically classify accumulation, manipulation, or distribution, and it does not generate PO3 trading signals. It is a visual analysis tool designed to support discretionary PO3 candle and Power of Three analysis.
HOW TO USE
Apply the indicator to a timeframe lower than the configured cluster timeframes. Use the current HTF open and optional previous midpoint as visual reference levels while comparing the developing candle with recently completed higher-timeframe candles.
Each cluster can be enabled, disabled, or styled independently. Auto Mode is useful when moving between chart timeframes, while Manual Mode provides full control over the displayed HTFs.
NOTES
The current HTF candle updates as new market data arrives and remains developing until its timeframe closes. Completed HTF candles remain fixed.
The indicator is intended for time-based charts. A cluster must use a timeframe higher than the current chart timeframe.
ORIGINALITY
Unlike single-timeframe HTF candle overlays, this script focuses on side-by-side comparison of up to three independently configurable candle clusters. It combines custom candle counts, Auto Mode, actual HTF open anchoring, optional previous-candle midpoint levels, live countdowns, and per-cluster styling in one overlay.
This indicator is a visualization and educational tool. It does not provide financial advice, trade recommendations, or guaranteed outcomes.
The indicator helps traders read higher-timeframe structure without leaving their execution timeframe. It provides a compact visual framework for HTF candle analysis, PO3 candle analysis, and discretionary Power of Three workflows.
KEY FEATURES
- Display up to three independent HTF candle clusters.
- Configure the timeframe and number of candles for each cluster.
- Use manual timeframes or enable Auto Mode to select suitable higher timeframes from the current chart timeframe.
- View the developing current HTF candle alongside completed HTF candles.
- Draw the current HTF open from its actual opening time to the projected current candle.
- Display the previous HTF candle midpoint when enabled.
- Show a live countdown for the current candle in each cluster.
- Combine the timeframe and countdown in a clean label positioned above the highest candle in the cluster.
- Customize bullish and bearish bodies, wicks, borders, open lines, midpoint lines, widths, colors, and line styles.
- Adjust candle width, candle spacing, cluster spacing, and right-side offset.
DEFAULT CONFIGURATION
- Auto Mode: enabled.
- Cluster 1: 15-minute timeframe, 6 candles.
- Cluster 2: 1-hour timeframe, 4 candles.
- Cluster 3: 1-day timeframe, 1 candle.
- Current HTF open lines: enabled with dotted style.
- Previous HTF midpoint lines: disabled by default and available per cluster.
- Countdown labels: enabled.
PO3 AND POWER OF THREE USE
PO3 traders can use the projected HTF candles to monitor the current higher-timeframe open, candle range, optional previous midpoint, and time remaining before the candle closes.
This indicator does not automatically classify accumulation, manipulation, or distribution, and it does not generate PO3 trading signals. It is a visual analysis tool designed to support discretionary PO3 candle and Power of Three analysis.
HOW TO USE
Apply the indicator to a timeframe lower than the configured cluster timeframes. Use the current HTF open and optional previous midpoint as visual reference levels while comparing the developing candle with recently completed higher-timeframe candles.
Each cluster can be enabled, disabled, or styled independently. Auto Mode is useful when moving between chart timeframes, while Manual Mode provides full control over the displayed HTFs.
NOTES
The current HTF candle updates as new market data arrives and remains developing until its timeframe closes. Completed HTF candles remain fixed.
The indicator is intended for time-based charts. A cluster must use a timeframe higher than the current chart timeframe.
ORIGINALITY
Unlike single-timeframe HTF candle overlays, this script focuses on side-by-side comparison of up to three independently configurable candle clusters. It combines custom candle counts, Auto Mode, actual HTF open anchoring, optional previous-candle midpoint levels, live countdowns, and per-cluster styling in one overlay.
This indicator is a visualization and educational tool. It does not provide financial advice, trade recommendations, or guaranteed outcomes.
發行說明
Fixed countdown timers in Bar Replay. The countdown now follows the active higher-timeframe close and advances with replay bars, while retaining wall-clock precision on live charts. Candle construction, cluster layout, and other indicators are unchanged.開源腳本
秉持TradingView一貫精神,這個腳本的創作者將其設為開源,以便交易者檢視並驗證其功能。向作者致敬!您可以免費使用此腳本,但請注意,重新發佈代碼需遵守我們的社群規範。

免責聲明
這些資訊和出版物並非旨在提供,也不構成TradingView提供或認可的任何形式的財務、投資、交易或其他類型的建議或推薦。請閱讀使用條款以了解更多資訊。
開源腳本
秉持TradingView一貫精神,這個腳本的創作者將其設為開源,以便交易者檢視並驗證其功能。向作者致敬!您可以免費使用此腳本,但請注意,重新發佈代碼需遵守我們的社群規範。
免責聲明
這些資訊和出版物並非旨在提供,也不構成TradingView提供或認可的任何形式的財務、投資、交易或其他類型的建議或推薦。請閱讀使用條款以了解更多資訊。