OPEN-SOURCE SCRIPT
已更新 Gap Fill Probability for SPY SPX XSP
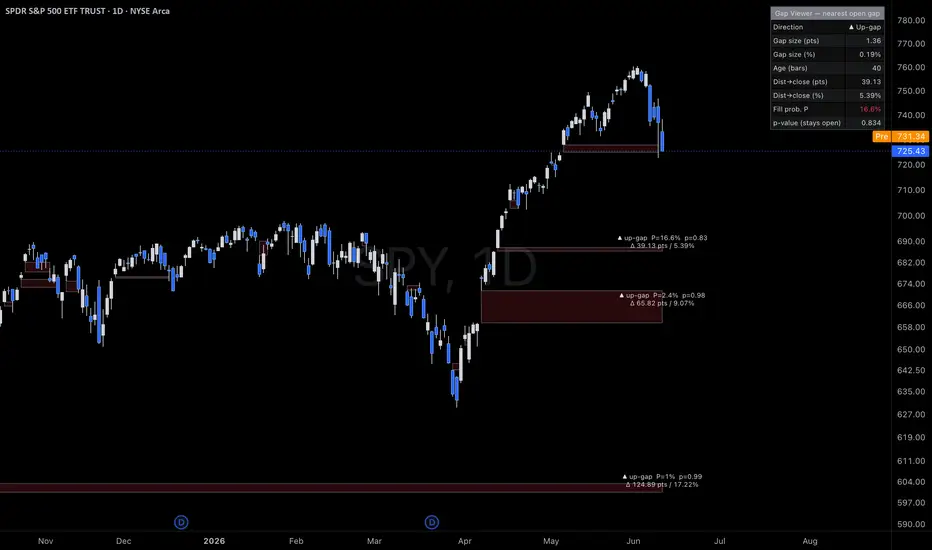
Gap Fill Probability Viewer - open gaps with an adaptive fill probability
Gap Fill Probability Viewer automatically finds price gaps on your chart and draws each one as a colored zone - no more drawing rectangles by hand. It then tells you how likely each open gap is to "fill," and exactly how far price has to travel to close it.
What it shows
How the probability works
The estimate adapts to three things research associates with gap fills:
- Size - bigger gaps are harder to fill.
- Distance - the closer price is to the gap, the higher the odds.
- Recency - fresh gaps fill faster; old, stubborn gaps lose momentum.
Handy options
- Auto-hide, fade, or keep gaps once they fill.
- Filter out tiny gaps by % or ATR.
- Detect gaps on wicks or candle bodies.
- Fully tunable probability model and colors.
⚠️ The fill probability is a heuristic estimate for study and education — not a guarantee or financial advice. Calibrate the settings to your own market and timeframe.
Gap Fill Probability Viewer automatically finds price gaps on your chart and draws each one as a colored zone - no more drawing rectangles by hand. It then tells you how likely each open gap is to "fill," and exactly how far price has to travel to close it.
What it shows
- Gap zones - every gap-up and gap-down, drawn as a box that extends to the current bar.
- Fill probability (P) - an estimate of how likely the gap is to close, shown as a % and color-coded (green = likely, orange = uncertain, red = unlikely).
- p-value - the flip side of P: the chance the gap stays open.
- Distance to close - how far the current price is from fully closing the gap, in both points and % of the charted symbol.
- Stats table - a clean summary for the gap closest to filling.
How the probability works
The estimate adapts to three things research associates with gap fills:
- Size - bigger gaps are harder to fill.
- Distance - the closer price is to the gap, the higher the odds.
- Recency - fresh gaps fill faster; old, stubborn gaps lose momentum.
Handy options
- Auto-hide, fade, or keep gaps once they fill.
- Filter out tiny gaps by % or ATR.
- Detect gaps on wicks or candle bodies.
- Fully tunable probability model and colors.
⚠️ The fill probability is a heuristic estimate for study and education — not a guarantee or financial advice. Calibrate the settings to your own market and timeframe.
發行說明
Renamed, Chart updated開源腳本
秉持TradingView一貫精神,這個腳本的創作者將其設為開源,以便交易者檢視並驗證其功能。向作者致敬!您可以免費使用此腳本,但請注意,重新發佈代碼需遵守我們的社群規範。

免責聲明
這些資訊和出版物並非旨在提供,也不構成TradingView提供或認可的任何形式的財務、投資、交易或其他類型的建議或推薦。請閱讀使用條款以了解更多資訊。
開源腳本
秉持TradingView一貫精神,這個腳本的創作者將其設為開源,以便交易者檢視並驗證其功能。向作者致敬!您可以免費使用此腳本,但請注意,重新發佈代碼需遵守我們的社群規範。
免責聲明
這些資訊和出版物並非旨在提供,也不構成TradingView提供或認可的任何形式的財務、投資、交易或其他類型的建議或推薦。請閱讀使用條款以了解更多資訊。