OPEN-SOURCE SCRIPT
ATR Swing Stop Loss (Long)
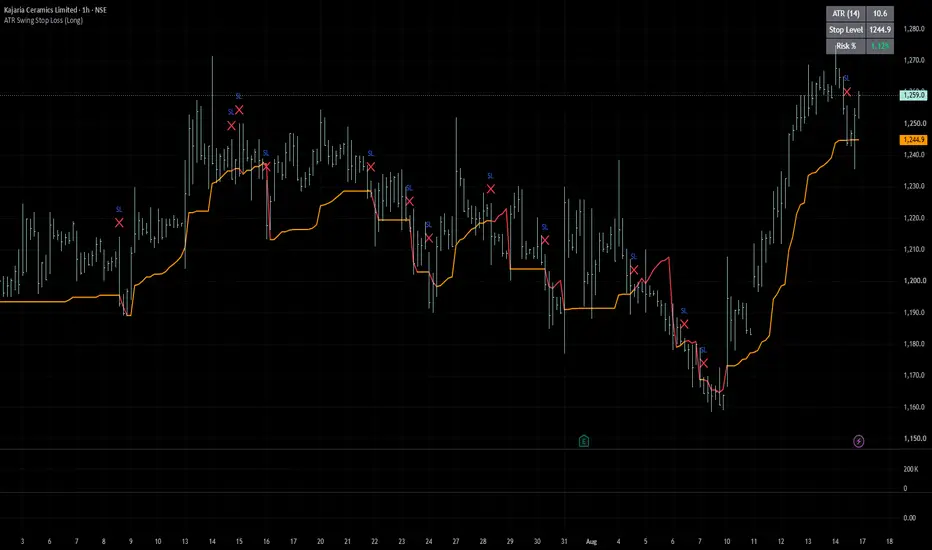
ATR Swing Stop Loss (Long) — Documentation
Purpose: Plots a trailing stop-loss line for long swing positions in Indian equities, based on Average True Range (ATR) volatility rather than a fixed percentage or arbitrary support level.
Core Logic
ATR Calculation — Measures 14-period average true range (Wilder's smoothing), capturing the stock's typical daily volatility.
Stop Level — Highest High (14 bars) − (ATR × 3.0). Anchoring to the recent high (not just current price) keeps the stop from tightening prematurely during a pullback within an uptrend.
Ratcheting — The stop only moves up, never down, as price makes new highs. This locks in gains as the trade progresses.
Reset on Breach — If a candle closes below the trailing stop, it's treated as a stop-out. The calculation resets fresh from that point (as if starting a new trade), and the line briefly turns red.
Inputs
Input Default Description
ATR Length 14 Lookback period for ATR and highest-high calculation
ATR Multiplier 3.0 Controls stop distance — lower = tighter stop, higher = more room
Show Info Table On Displays ATR value, stop price, and risk % in top-right corner
Show Stop-Hit Markers On Plots an "SL" cross marker when price closes below the stop
Visual Output
Orange line — active trailing stop
Red line/marker — stop was just breached (exit signal)
Info table — current ATR, stop level, and % distance from close to stop (useful for position sizing/risk calc)
Alerts
One built-in alert condition: "Long ATR Stop Hit" — fires when price closes below the trailing stop. Set this up via TradingView's Alert panel to get notified without watching the chart.
Usage Notes
Designed for daily timeframe swing trades; can be used intraday but multiplier/length may need adjustment for lower timeframes.
Works best on trending stocks — in sideways/choppy names it may whipsaw more often near the 3× ATR threshold.
Long-only. Does not track entry price or position size — it's a volatility-based exit reference, not a full position manager.
Not signal generation — this indicator does not tell you when to enter, only where to consider exiting once you're long.
Suggested Workflow
Add to your stock's daily chart alongside your entry signal/strategy.
Enter long per your own setup.
Use the plotted stop as your live stop-loss reference — adjust broker SL order as the line ratchets up.
Exit (or tighten manually) when the "SL" marker appears or your alert fires.
開源腳本
秉持TradingView一貫精神,這個腳本的創作者將其設為開源,以便交易者檢視並驗證其功能。向作者致敬!您可以免費使用此腳本,但請注意,重新發佈代碼需遵守我們的社群規範。

免責聲明
這些資訊和出版物並非旨在提供,也不構成TradingView提供或認可的任何形式的財務、投資、交易或其他類型的建議或推薦。請閱讀使用條款以了解更多資訊。
免責聲明
這些資訊和出版物並非旨在提供,也不構成TradingView提供或認可的任何形式的財務、投資、交易或其他類型的建議或推薦。請閱讀使用條款以了解更多資訊。