OPEN-SOURCE SCRIPT
已更新 MoonBoys Line
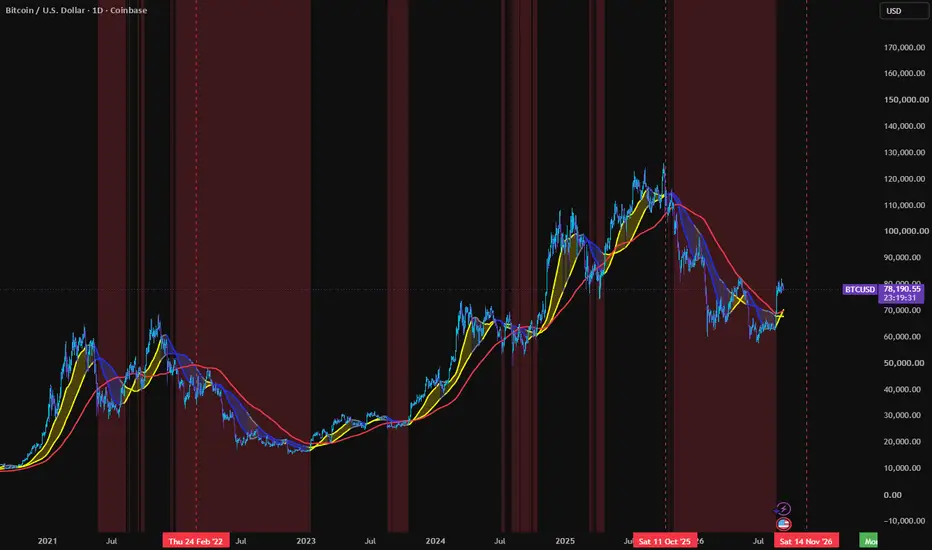
MoonBoys Line – Market Regime & Trend Confirmation Indicator
The MoonBoys Line is a simple but powerful trend-following system designed to identify bullish and bearish market regimes using key daily moving averages.
Built around the 44, 125, and 200-day SMAs, this indicator helps you quickly determine trend direction, strength, and key areas of support/resistance.
🔍 How It Works
44 SMA (Fast Line) → Short-term trend
125 SMA (Slow Line) → Mid-term trend (key reclaim level)
200 SMA (Red Line) → Macro trend / “fair value” baseline
🟡 Bullish Regime
Price is above both the 44 & 125 SMAs
Lines turn yellow
Band turns gold
Indicates strong upward momentum and trend continuation
🔵 Bearish Regime
Price is below both the 44 & 125 SMAs
Lines turn blue
Band turns blue
Signals downside momentum and potential continuation lower
⚪ Neutral / Chop
Price is between the 44 and 125
Lines turn gray
Indicates uncertainty or consolidation
🔴 Risk Zone (200 SMA)
When price falls below the 200 SMA, the background turns red
This highlights high-risk conditions and potential macro weakness
🧠 How We Use It (Moon Boys Strategy)
Reclaim of 125 SMA = early signal of bullish reversal
Holding above 44 SMA = trend strength confirmation
Losing 125 SMA = caution / trend weakening
Below 200 SMA = risk-off environment
This indicator is designed to keep you on the right side of the trend and avoid getting chopped up in uncertain markets.
The MoonBoys Line is a simple but powerful trend-following system designed to identify bullish and bearish market regimes using key daily moving averages.
Built around the 44, 125, and 200-day SMAs, this indicator helps you quickly determine trend direction, strength, and key areas of support/resistance.
🔍 How It Works
44 SMA (Fast Line) → Short-term trend
125 SMA (Slow Line) → Mid-term trend (key reclaim level)
200 SMA (Red Line) → Macro trend / “fair value” baseline
🟡 Bullish Regime
Price is above both the 44 & 125 SMAs
Lines turn yellow
Band turns gold
Indicates strong upward momentum and trend continuation
🔵 Bearish Regime
Price is below both the 44 & 125 SMAs
Lines turn blue
Band turns blue
Signals downside momentum and potential continuation lower
⚪ Neutral / Chop
Price is between the 44 and 125
Lines turn gray
Indicates uncertainty or consolidation
🔴 Risk Zone (200 SMA)
When price falls below the 200 SMA, the background turns red
This highlights high-risk conditions and potential macro weakness
🧠 How We Use It (Moon Boys Strategy)
Reclaim of 125 SMA = early signal of bullish reversal
Holding above 44 SMA = trend strength confirmation
Losing 125 SMA = caution / trend weakening
Below 200 SMA = risk-off environment
This indicator is designed to keep you on the right side of the trend and avoid getting chopped up in uncertain markets.
發行說明
Optimizing the moving averaged:44 becomes 50
125 becomes 116
As per Gerhard, 116 is more profitable for bitcoin than 125. 50 is for trading perps, 116 is for trading spot.
開源腳本
秉持TradingView一貫精神,這個腳本的創作者將其設為開源,以便交易者檢視並驗證其功能。向作者致敬!您可以免費使用此腳本,但請注意,重新發佈代碼需遵守我們的社群規範。

Not Financial Advice
免責聲明
這些資訊和出版物並非旨在提供,也不構成TradingView提供或認可的任何形式的財務、投資、交易或其他類型的建議或推薦。請閱讀使用條款以了解更多資訊。
開源腳本
秉持TradingView一貫精神,這個腳本的創作者將其設為開源,以便交易者檢視並驗證其功能。向作者致敬!您可以免費使用此腳本,但請注意,重新發佈代碼需遵守我們的社群規範。
Not Financial Advice
免責聲明
這些資訊和出版物並非旨在提供,也不構成TradingView提供或認可的任何形式的財務、投資、交易或其他類型的建議或推薦。請閱讀使用條款以了解更多資訊。