Momentum Core [MasterTonyTA]
# Momentum Core — Publish Description
---
## WHAT IT IS
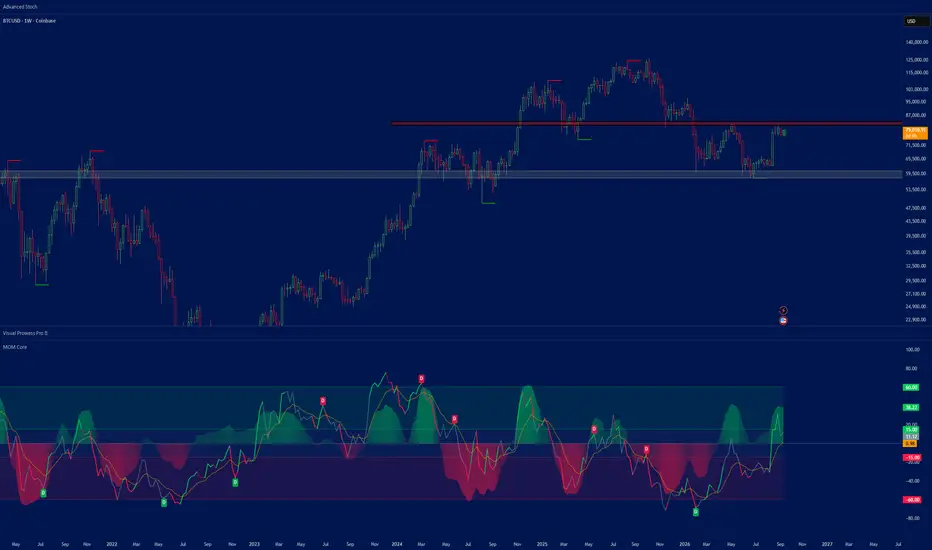
Momentum Core is a composite momentum oscillator that blends four non-redundant momentum sources into a single normalized reading, then layers on a MACD-derived wave, a volatility/participation regime gate, and health zones that separate tradeable momentum from both chop and exhaustion.
Most momentum oscillators measure the same thing twice. MACD is essentially rate-of-change on EMAs. Stochastic and RSI both measure position within range. CCI overlaps normalized ROC. Stacking those gives you four confirmations of one idea and a false sense of confluence.
This indicator deliberately selects sources that measure **different** things: smoothed directional force, volatility-adjusted velocity, thrust acceleration, and participation. Each is z-scored against its own recent history before being weighted, so no single component can dominate simply because it has a larger raw scale.
---
## HOW TO READ IT
### The Momentum Line (main plot)
The line is the composite reading, squashed to a **-100 to +100** range. Its color encodes two things at once:
| Color | Meaning |
|---|---|
| **Solid green** | Momentum rising, above signal line — clean bullish impulse |
| **Faded green** | Momentum rising, below signal line — early turn, not yet confirmed |
| **Faded red** | Momentum falling, above signal line — exhaustion; the move is decaying while still reading positive |
| **Solid red** | Momentum falling, below signal line — clean bearish impulse |
| **Grey / dimmed** | Regime gate failed — ADX or relative volume too low to trust the reading |
The key read is the **faded states**. A faded red above the signal line is the earliest exit tell in the indicator: price may still be making highs, but the force behind it is already draining. A faded green below the signal is the mirror — the turn has started before the crossover confirms it.
Direction is set by the **slope** of momentum, not by its position. A deadzone input prevents flicker during flat patches — the last direction holds until slope decisively flips.
### The Signal Line (orange)
A 9-period EMA of the composite. It is not a trade trigger on its own; it defines conviction. The wider the gap between momentum and signal, the stronger the current state. Crossovers matter most when they happen **inside a good zone** rather than in chop.
### The Momentum Wave (area fill)
A MACD histogram, z-scored and squashed onto the same scale as the main line. This is the cycle-rhythm layer — it shows you the breathing pattern of impulses.
- **Green** above zero, **red** below zero — always, regardless of the main line's state
- **Transparency scales with magnitude** — solid means a strong impulse, faded means a decaying one
By default the wave carries **zero weight** in the composite, so it is purely visual. This is intentional: MACD overlaps TSI, and scoring both double-counts the same signal. The weight input exists if you want it, but keep it at or below 0.5.
The wave's most useful read is **disagreement with the main line**. When the line is green and the wave is fading toward zero, the impulse is losing its engine.
### The Zones
Four regions, defined by two boundaries per side:
- **Bull good zone (+15 to +60)** — shaded green. Momentum is meaningfully positive but not stretched. This is where trends actually run.
- **Bear good zone (-15 to -60)** — shaded red. Same logic, downside.
- **Chop zone (-15 to +15)** — shaded neutral. Momentum lacks conviction. Signals here have the worst expectancy in the entire indicator.
- **Overextended (beyond ±60)** — unshaded. Momentum is stretched; continuation still happens, but reward-to-risk on new entries is poor and mean reversion risk is elevated.
Treat zones as a filter, not a signal. A crossover in the good zone and the identical crossover in chop are not the same event.
### Divergence Labels
**D** labels mark divergence between the composite and price, detected on confirmed pivots. A bullish divergence prints when price makes a lower low while momentum makes a higher low; bearish is the inverse. Labels are offset back to the pivot bar, so they confirm with a lag equal to the right-pivot setting — this is by design, since unconfirmed pivots repaint.
---
## THE CALCULATIONS
### Step 1 — Component extraction
**TSI (True Strength Index)** — double-smoothed momentum, default 13/25. Chosen over MACD because the double smoothing removes most whipsaw while keeping the zero-line cross meaningful.
**ATR-Normalized ROC** — `(close - close[n]) / ATR(n)`. Dividing by ATR is what makes this portable: a 2% move in a quiet tape and a 2% move in a volatile one produce very different readings, which is correct. Raw ROC would treat them identically.
**RSI Velocity** — the *change* in RSI over a short window, not the RSI level itself. Level tells you where you are in the range; velocity tells you how hard you are moving through it. Velocity turns first.
**OBV Slope** — change in OBV over n bars, normalized by average volume so it scales across instruments. This is the participation check. Momentum without volume behind it is a fade waiting to happen.
### Step 2 — Normalization
Each component is converted to a **z-score** against its own trailing mean and standard deviation over the lookback window:
```
z = (value - SMA(value, len)) / STDEV(value, len)
```
This is the step that makes the blend legitimate. Without it, TSI (roughly ±100 scale) would swamp OBV slope (unbounded, instrument-dependent) regardless of the weights you set. After z-scoring, every component speaks the same language: standard deviations from its own normal.
### Step 3 — Weighted composite and squash
Z-scores are combined as a weighted average, then compressed through a logistic function:
```
raw = Σ(zᵢ × wᵢ) / Σ(wᵢ)
mom = 100 × (2 / (1 + e^(-raw × 0.9)) - 1)
```
The sigmoid squash bounds the output to ±100 while preserving resolution in the middle of the range, where most trading decisions actually happen. A hard clamp would flatten all extreme readings into an identical value and destroy the distinction between "strong" and "absurd." The sigmoid compresses the tails smoothly instead.
Default weights: TSI 1.2, ROC 1.0, RSI velocity 0.8, OBV slope 0.7, wave 0.0.
### Step 4 — Signal and acceleration
```
signal = EMA(mom, 9)
accel = EMA(Δmom, 3)
```
`accel` is the second derivative of momentum — the rate of change of the rate of change. It drives the line's directional coloring and the exhaustion alerts. This is the component most oscillators omit entirely, and it is what lets the indicator flag a decaying impulse before any crossover occurs.
### Step 5 — Regime gate
```
gateOK = ADX ≥ threshold AND relativeVolume ≥ threshold
```
When the gate fails, the momentum line dims to grey. Nothing is hidden or suppressed — you still see the full reading — but the visual weight drops, because momentum readings during low-ADX, low-participation conditions are mostly noise. Relative volume is current volume against its 20-period average.
---
## SETTINGS THAT MATTER MOST
**Z-Score Lookback (default 100)** — the single most impactful input. This is the window that defines "normal." For intraday and short-dated options work, drop it to **50**; the 100-bar window is too slow to adapt within a session. For daily and swing timeframes, leave at 100 or extend to 150.
**ROC Length (default 14)** — pair with the lookback. Intraday, drop to **7**.
**Slope Deadzone (default 0.15)** — raise toward 0.3 if the line flips color more often than you want. This trades responsiveness for stability.
**Wave Sensitivity** — the divisor in the wave transparency calculation. Lower it to 35 if the wave rarely reaches full opacity on your instrument; raise to 70 if everything saturates.
**Weights** — the defaults are a reasonable starting point, not a result of optimization. If you trade a volume-thin instrument, cut the OBV weight. If you trade something gappy, lean harder on the ATR-normalized ROC.
---
## ALERTS INCLUDED
- Momentum Flip Bull / Bear — zero cross with the regime gate passing
- Bull / Bear Exhaustion — momentum at an extreme while decelerating
- Bullish / Bearish Divergence
- Wave Flip Bull / Bear — momentum wave crossing zero
- Wave Stalling — wave rolling over without crossing
- Enter Bull Zone / Enter Bear Zone
- Overextended
---
## NOTES AND LIMITATIONS
Divergence labels confirm on a lag equal to the right-pivot setting. This is unavoidable in honest pivot detection — anything faster repaints.
The z-score normalization means readings are **relative to recent history**, not absolute. A +70 reading in a quiet regime and a +70 in a volatile one represent different raw moves. This is the intended behavior, but it means you should not port threshold settings between instruments without checking them.
This is an indicator, not a system. It has no position sizing, no stop logic, and no backtest attached. Zones and gates are filters that improve signal quality; they do not create an edge on their own.
---
*Author: MasterTonyTA*
---
## WHAT IT IS
Momentum Core is a composite momentum oscillator that blends four non-redundant momentum sources into a single normalized reading, then layers on a MACD-derived wave, a volatility/participation regime gate, and health zones that separate tradeable momentum from both chop and exhaustion.
Most momentum oscillators measure the same thing twice. MACD is essentially rate-of-change on EMAs. Stochastic and RSI both measure position within range. CCI overlaps normalized ROC. Stacking those gives you four confirmations of one idea and a false sense of confluence.
This indicator deliberately selects sources that measure **different** things: smoothed directional force, volatility-adjusted velocity, thrust acceleration, and participation. Each is z-scored against its own recent history before being weighted, so no single component can dominate simply because it has a larger raw scale.
---
## HOW TO READ IT
### The Momentum Line (main plot)
The line is the composite reading, squashed to a **-100 to +100** range. Its color encodes two things at once:
| Color | Meaning |
|---|---|
| **Solid green** | Momentum rising, above signal line — clean bullish impulse |
| **Faded green** | Momentum rising, below signal line — early turn, not yet confirmed |
| **Faded red** | Momentum falling, above signal line — exhaustion; the move is decaying while still reading positive |
| **Solid red** | Momentum falling, below signal line — clean bearish impulse |
| **Grey / dimmed** | Regime gate failed — ADX or relative volume too low to trust the reading |
The key read is the **faded states**. A faded red above the signal line is the earliest exit tell in the indicator: price may still be making highs, but the force behind it is already draining. A faded green below the signal is the mirror — the turn has started before the crossover confirms it.
Direction is set by the **slope** of momentum, not by its position. A deadzone input prevents flicker during flat patches — the last direction holds until slope decisively flips.
### The Signal Line (orange)
A 9-period EMA of the composite. It is not a trade trigger on its own; it defines conviction. The wider the gap between momentum and signal, the stronger the current state. Crossovers matter most when they happen **inside a good zone** rather than in chop.
### The Momentum Wave (area fill)
A MACD histogram, z-scored and squashed onto the same scale as the main line. This is the cycle-rhythm layer — it shows you the breathing pattern of impulses.
- **Green** above zero, **red** below zero — always, regardless of the main line's state
- **Transparency scales with magnitude** — solid means a strong impulse, faded means a decaying one
By default the wave carries **zero weight** in the composite, so it is purely visual. This is intentional: MACD overlaps TSI, and scoring both double-counts the same signal. The weight input exists if you want it, but keep it at or below 0.5.
The wave's most useful read is **disagreement with the main line**. When the line is green and the wave is fading toward zero, the impulse is losing its engine.
### The Zones
Four regions, defined by two boundaries per side:
- **Bull good zone (+15 to +60)** — shaded green. Momentum is meaningfully positive but not stretched. This is where trends actually run.
- **Bear good zone (-15 to -60)** — shaded red. Same logic, downside.
- **Chop zone (-15 to +15)** — shaded neutral. Momentum lacks conviction. Signals here have the worst expectancy in the entire indicator.
- **Overextended (beyond ±60)** — unshaded. Momentum is stretched; continuation still happens, but reward-to-risk on new entries is poor and mean reversion risk is elevated.
Treat zones as a filter, not a signal. A crossover in the good zone and the identical crossover in chop are not the same event.
### Divergence Labels
**D** labels mark divergence between the composite and price, detected on confirmed pivots. A bullish divergence prints when price makes a lower low while momentum makes a higher low; bearish is the inverse. Labels are offset back to the pivot bar, so they confirm with a lag equal to the right-pivot setting — this is by design, since unconfirmed pivots repaint.
---
## THE CALCULATIONS
### Step 1 — Component extraction
**TSI (True Strength Index)** — double-smoothed momentum, default 13/25. Chosen over MACD because the double smoothing removes most whipsaw while keeping the zero-line cross meaningful.
**ATR-Normalized ROC** — `(close - close[n]) / ATR(n)`. Dividing by ATR is what makes this portable: a 2% move in a quiet tape and a 2% move in a volatile one produce very different readings, which is correct. Raw ROC would treat them identically.
**RSI Velocity** — the *change* in RSI over a short window, not the RSI level itself. Level tells you where you are in the range; velocity tells you how hard you are moving through it. Velocity turns first.
**OBV Slope** — change in OBV over n bars, normalized by average volume so it scales across instruments. This is the participation check. Momentum without volume behind it is a fade waiting to happen.
### Step 2 — Normalization
Each component is converted to a **z-score** against its own trailing mean and standard deviation over the lookback window:
```
z = (value - SMA(value, len)) / STDEV(value, len)
```
This is the step that makes the blend legitimate. Without it, TSI (roughly ±100 scale) would swamp OBV slope (unbounded, instrument-dependent) regardless of the weights you set. After z-scoring, every component speaks the same language: standard deviations from its own normal.
### Step 3 — Weighted composite and squash
Z-scores are combined as a weighted average, then compressed through a logistic function:
```
raw = Σ(zᵢ × wᵢ) / Σ(wᵢ)
mom = 100 × (2 / (1 + e^(-raw × 0.9)) - 1)
```
The sigmoid squash bounds the output to ±100 while preserving resolution in the middle of the range, where most trading decisions actually happen. A hard clamp would flatten all extreme readings into an identical value and destroy the distinction between "strong" and "absurd." The sigmoid compresses the tails smoothly instead.
Default weights: TSI 1.2, ROC 1.0, RSI velocity 0.8, OBV slope 0.7, wave 0.0.
### Step 4 — Signal and acceleration
```
signal = EMA(mom, 9)
accel = EMA(Δmom, 3)
```
`accel` is the second derivative of momentum — the rate of change of the rate of change. It drives the line's directional coloring and the exhaustion alerts. This is the component most oscillators omit entirely, and it is what lets the indicator flag a decaying impulse before any crossover occurs.
### Step 5 — Regime gate
```
gateOK = ADX ≥ threshold AND relativeVolume ≥ threshold
```
When the gate fails, the momentum line dims to grey. Nothing is hidden or suppressed — you still see the full reading — but the visual weight drops, because momentum readings during low-ADX, low-participation conditions are mostly noise. Relative volume is current volume against its 20-period average.
---
## SETTINGS THAT MATTER MOST
**Z-Score Lookback (default 100)** — the single most impactful input. This is the window that defines "normal." For intraday and short-dated options work, drop it to **50**; the 100-bar window is too slow to adapt within a session. For daily and swing timeframes, leave at 100 or extend to 150.
**ROC Length (default 14)** — pair with the lookback. Intraday, drop to **7**.
**Slope Deadzone (default 0.15)** — raise toward 0.3 if the line flips color more often than you want. This trades responsiveness for stability.
**Wave Sensitivity** — the divisor in the wave transparency calculation. Lower it to 35 if the wave rarely reaches full opacity on your instrument; raise to 70 if everything saturates.
**Weights** — the defaults are a reasonable starting point, not a result of optimization. If you trade a volume-thin instrument, cut the OBV weight. If you trade something gappy, lean harder on the ATR-normalized ROC.
---
## ALERTS INCLUDED
- Momentum Flip Bull / Bear — zero cross with the regime gate passing
- Bull / Bear Exhaustion — momentum at an extreme while decelerating
- Bullish / Bearish Divergence
- Wave Flip Bull / Bear — momentum wave crossing zero
- Wave Stalling — wave rolling over without crossing
- Enter Bull Zone / Enter Bear Zone
- Overextended
---
## NOTES AND LIMITATIONS
Divergence labels confirm on a lag equal to the right-pivot setting. This is unavoidable in honest pivot detection — anything faster repaints.
The z-score normalization means readings are **relative to recent history**, not absolute. A +70 reading in a quiet regime and a +70 in a volatile one represent different raw moves. This is the intended behavior, but it means you should not port threshold settings between instruments without checking them.
This is an indicator, not a system. It has no position sizing, no stop logic, and no backtest attached. Zones and gates are filters that improve signal quality; they do not create an edge on their own.
---
*Author: MasterTonyTA*

免責聲明
這些資訊和出版物並非旨在提供,也不構成TradingView提供或認可的任何形式的財務、投資、交易或其他類型的建議或推薦。請閱讀使用條款以了解更多資訊。
免責聲明
這些資訊和出版物並非旨在提供,也不構成TradingView提供或認可的任何形式的財務、投資、交易或其他類型的建議或推薦。請閱讀使用條款以了解更多資訊。