OPEN-SOURCE SCRIPT
已更新 P12 Session Levels
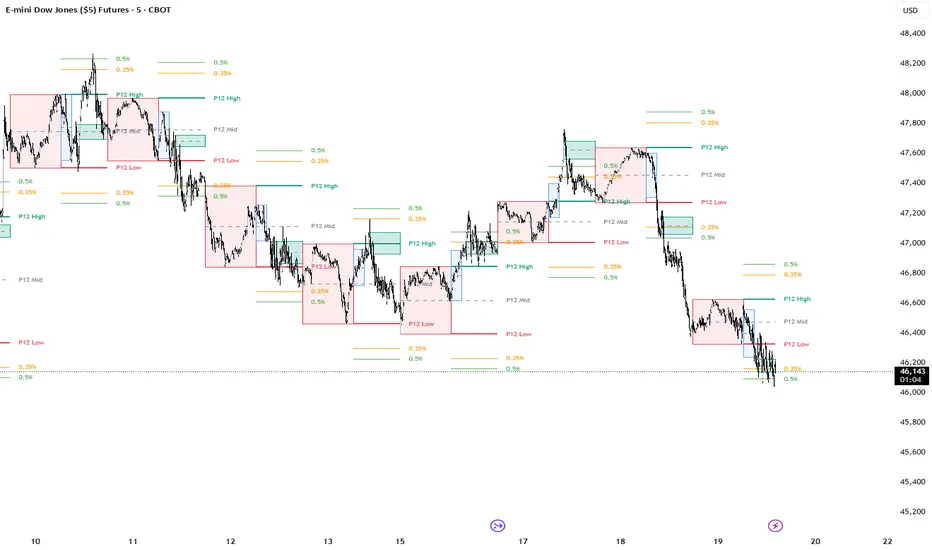
P12 – Previous 12 Hour Range
The P12 (Previous 12 Hour Range) indicator visualizes the high and low of the prior 12-hour period to provide a clear reference for current session context. The previous range can often act as a structural boundary where price may react, consolidate, or expand beyond as new liquidity enters the market.
By highlighting the prior 12-hour range directly on the chart, traders can quickly identify areas where price is interacting with recent market structure. Breaks, rejections, or rotations around this range can provide useful context for intraday analysis.
This concept is similar to approaches that study how price behaves relative to prior session ranges. Tools such as The Daily Profiler analyze historical session behavior to identify when highs and lows tend to occur. The P12 range provides a simple structural reference that traders can use alongside statistical timing studies, volume profile levels, or other forms of market structure analysis.
Features
Displays the high and low of the previous 12-hour range
Updates automatically as new sessions form
Helps visualize recent structural boundaries in the market
Can be combined with other analytical tools for context
This indicator is intended as a visual reference tool for studying market structure and range behavior and should be used alongside a trader’s existing analysis methods.
I personally use these extension levels with YM, you can find your own that work with you.
The P12 (Previous 12 Hour Range) indicator visualizes the high and low of the prior 12-hour period to provide a clear reference for current session context. The previous range can often act as a structural boundary where price may react, consolidate, or expand beyond as new liquidity enters the market.
By highlighting the prior 12-hour range directly on the chart, traders can quickly identify areas where price is interacting with recent market structure. Breaks, rejections, or rotations around this range can provide useful context for intraday analysis.
This concept is similar to approaches that study how price behaves relative to prior session ranges. Tools such as The Daily Profiler analyze historical session behavior to identify when highs and lows tend to occur. The P12 range provides a simple structural reference that traders can use alongside statistical timing studies, volume profile levels, or other forms of market structure analysis.
Features
Displays the high and low of the previous 12-hour range
Updates automatically as new sessions form
Helps visualize recent structural boundaries in the market
Can be combined with other analytical tools for context
This indicator is intended as a visual reference tool for studying market structure and range behavior and should be used alongside a trader’s existing analysis methods.
I personally use these extension levels with YM, you can find your own that work with you.
發行說明
Updated extensions to change to user settings.Added 0600-0830 range and 930 opening range.
發行說明
***開源腳本
秉持TradingView一貫精神,這個腳本的創作者將其設為開源,以便交易者檢視並驗證其功能。向作者致敬!您可以免費使用此腳本,但請注意,重新發佈代碼需遵守我們的社群規範。

免責聲明
這些資訊和出版物並非旨在提供,也不構成TradingView提供或認可的任何形式的財務、投資、交易或其他類型的建議或推薦。請閱讀使用條款以了解更多資訊。
免責聲明
這些資訊和出版物並非旨在提供,也不構成TradingView提供或認可的任何形式的財務、投資、交易或其他類型的建議或推薦。請閱讀使用條款以了解更多資訊。