OPEN-SOURCE SCRIPT
BTC Trump China Visit
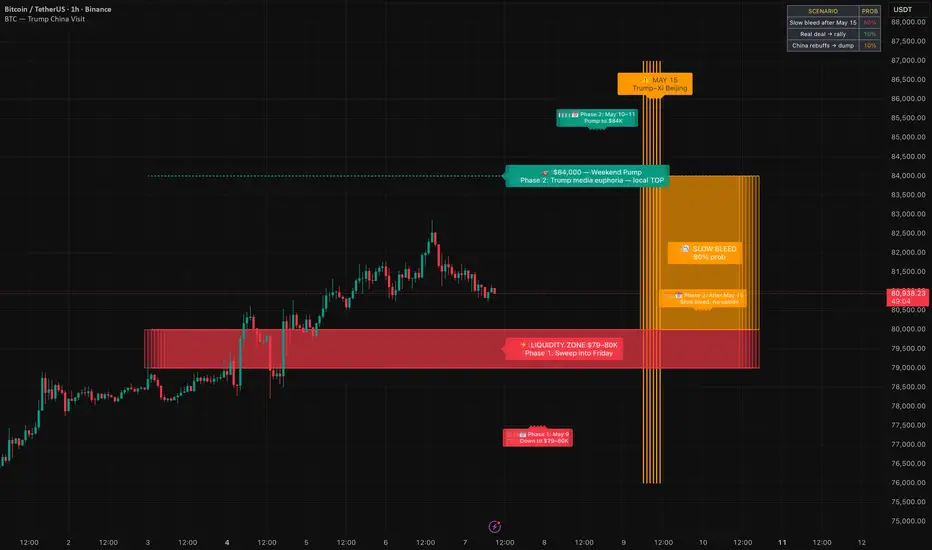
This script visualizes a concrete BTC price scenario built around the Trump–Xi Beijing meeting on May 15.
What's plotted:
• $79,000–$80,000 liquidity zone (Phase 1 target — sweep before May 9)
• $84,000 level (Phase 2 — speculative weekend pump on Trump media)
• May 15 vertical line — the meeting date, expected local top
• Post-May 15 slow bleed zone (Phase 3)
• Probability table: 80% slow bleed / 10% real deal rally / 10% sharp dump
The thesis: markets overpriced ceasefire signals. China won't concede before the visit — they need Trump coming to them, not the other way around. Euphoria peaks into the meeting. Reality hits after. Same mechanics as the October 2025 APEC setup, where BTC dropped from $111K to $108.5K on no joint press conference.
This is not "if we go up we go up" analysis. Concrete levels, concrete timing, full accountability.
開源腳本
秉持TradingView一貫精神,這個腳本的創作者將其設為開源,以便交易者檢視並驗證其功能。向作者致敬!您可以免費使用此腳本,但請注意,重新發佈代碼需遵守我們的社群規範。

免責聲明
這些資訊和出版物並非旨在提供,也不構成TradingView提供或認可的任何形式的財務、投資、交易或其他類型的建議或推薦。請閱讀使用條款以了解更多資訊。
免責聲明
這些資訊和出版物並非旨在提供,也不構成TradingView提供或認可的任何形式的財務、投資、交易或其他類型的建議或推薦。請閱讀使用條款以了解更多資訊。