OPEN-SOURCE SCRIPT
Choppiness ZONE Overlay
Purpose
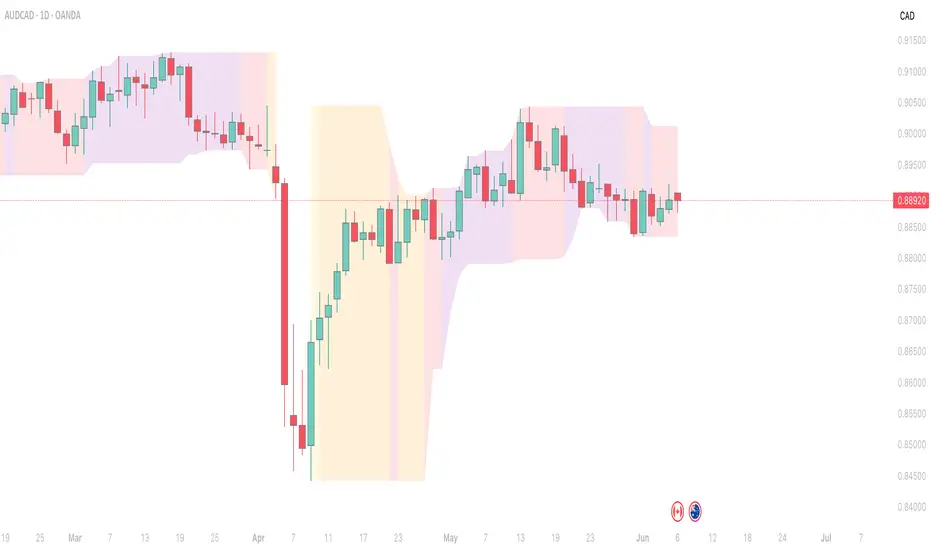
This script overlays choppiness zones directly onto the price chart to help traders identify whether the market is trending or ranging. It is designed to filter out low-probability trades during high choppiness conditions.
How It Works
Features
Tip
Use this tool as a volatility or trend filter. Combine it with momentum or trend-following indicators to improve trade selection.
This script overlays choppiness zones directly onto the price chart to help traders identify whether the market is trending or ranging. It is designed to filter out low-probability trades during high choppiness conditions.
How It Works
- Calculates the Choppiness Index over a user-defined period using ATR and price range.
- Divides choppiness into four zones:
30 to 40: Low choppiness, possible trend initiation, shown in yellow.
40 to 50: Moderate choppiness, transition zone, shown in orange.
50 to 60: High choppiness, weakening momentum, shown in red.
60 and above: Extreme choppiness, avoid trading, shown in purple. - Highlights each zone with customizable color fills between the high and low of the selected range.
- Triggers a real-time alert when choppiness exceeds 60.
Features
- Customizable choppiness zones and color settings.
- Real-time alert when market becomes extremely choppy (choppiness ≥ 60).
- Visual zone overlay on the price chart.
- Compatible with all timeframes.
- Lightweight and responsive for scalping, intraday, or swing trading.
Tip
Use this tool as a volatility or trend filter. Combine it with momentum or trend-following indicators to improve trade selection.
開源腳本
秉持TradingView一貫精神,這個腳本的創作者將其設為開源,以便交易者檢視並驗證其功能。向作者致敬!您可以免費使用此腳本,但請注意,重新發佈代碼需遵守我們的社群規範。

免責聲明
這些資訊和出版物並非旨在提供,也不構成TradingView提供或認可的任何形式的財務、投資、交易或其他類型的建議或推薦。請閱讀使用條款以了解更多資訊。
開源腳本
秉持TradingView一貫精神,這個腳本的創作者將其設為開源,以便交易者檢視並驗證其功能。向作者致敬!您可以免費使用此腳本,但請注意,重新發佈代碼需遵守我們的社群規範。
免責聲明
這些資訊和出版物並非旨在提供,也不構成TradingView提供或認可的任何形式的財務、投資、交易或其他類型的建議或推薦。請閱讀使用條款以了解更多資訊。