Kalman-Referenced Hurst Regime + AKF Bands + FLD
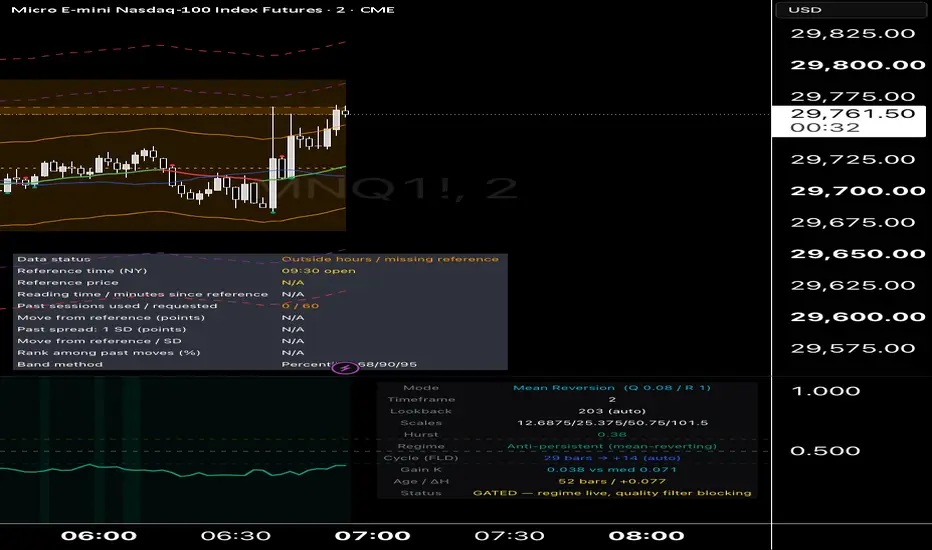
# KF-Hurst: Kalman-Referenced Hurst Regime + Adaptive Kalman Bands
A complete plain-English description: what the indicator does, why, and how — followed by the trade setups it is built to serve.
---
## 1. What it is, in one paragraph
This is a regime classifier, not a signal generator. It answers three questions in order: **Where is fair value right now?** (the Kalman filter), **Is the market behaving in a way worth trading at all, and if so, in which style?** (the Hurst regime engine), and **Is right now a good moment within that regime?** (the quality gates and the FLD cycle timer). It deliberately produces no buy or sell arrows of its own. It tells you whether conditions permit a setup, and leaves the entry to you.
Everything runs from one script. The Kalman line and its bands draw on the price chart; the Hurst regime line, status table and background tints live in a separate panel below.
---
## 2. The components
### 2.1 The Kalman filter — the dynamic mean
**What it does.** Draws a single line on the price chart: the filter's running estimate of where price "should" be, given everything seen so far. Around it sit up to three pairs of bands (1×, 2×, 3×), measured in units of innovation size — the typical distance between actual price and the estimate.
**Why.** Every mean-reversion and trend concept needs a reference for "normal". A moving average is the usual choice, but a moving average is a static idea: it weights the last N bars the same way regardless of whether the market is calm or violent. The Kalman filter replaces that with an ongoing act of estimation. It carries a view of where price is, plus a measure of how confident it is in that view, and updates both every bar.
**How.** Each bar the filter performs two steps. First, *prediction*: it assumes price stays where its estimate currently is, but widens its uncertainty by an amount proportional to current volatility (the process noise, scaled by the Q multiplier). Second, *update*: it compares the new actual price against the prediction and moves the estimate towards the price by a fraction — the Kalman gain, K — that depends on how much it trusts the new observation versus its own estimate. That trust ratio is set by measurement noise (the R multiplier) against process noise (Q), both scaled by current volatility (ATR or standard deviation over the Adaptivity Lookback). High volatility with a high R makes the filter sceptical of new prices — more smoothing. High Q makes it quick to abandon its estimate — faster adaptation. The bands are built from the root-mean-square of past innovations, so they widen automatically when price has been straying far from the estimate and contract when it has been obedient.
The gain K is not discarded; it is stored and used later as a quality gate (section 2.5).
### 2.2 Setup modes — one indicator, two temperaments
**What it does.** A single dropdown — Mean Reversion, Trend Following, or Custom — that swaps the Kalman noise settings between two tested presets.
**Why.** The two trading styles need contradictory filter behaviour, and this is not a matter of preference but of mathematics. Mean reversion needs a filter that tracks price closely (fast: Q 0.08, R 1.0), so that "distance from fair value" is measured against a fair value that is itself current. Trend detection needs a filter that deliberately lags (slow: Q 0.02, R 1.4), because the regime test (section 2.3) measures the *leftover* persistence after the filter has explained what it can. If the filter follows a trend perfectly, nothing is left over and the trend regime can never register. The lag is what makes trend detection possible.
**How.** The preset overrides the R and Q multipliers (Custom mode restores manual control). Because the Hurst auto-optimisation reads the effective Q, switching mode also re-tunes the Hurst lookback automatically — slower filter, longer window. You can run two charts with different modes, or flip one chart's mode in two clicks when the tape changes character.
### 2.3 The Kalman-referenced Hurst exponent — the regime engine
**What it does.** The line in the lower panel, bounded between 0 and 1, with three reference levels: 0.40 (below = anti-persistent, mean-reverting), 0.50 (random walk), 0.60 (above = persistent, trending).
**Why.** The single most expensive trading error is applying the right technique to the wrong market state — fading a trend, or chasing a range. The Hurst exponent is a direct measurement of market character: whether price movements tend to continue (H above 0.5) or reverse (H below 0.5). But the standard Hurst calculation measures returns against a *static* average, which means a strong trend inflates the reading mechanically. This version measures each return against the Kalman filter's own implied drift at that bar — the filter's state estimate expressed as a per-bar return. In plain terms: the filter first explains as much of the movement as it can, and the Hurst line then measures the character of *what the filter could not explain*. Persistence in the leftovers is genuine persistence; mean-reversion in the leftovers is genuine mean-reversion.
**How.** A rescaled-range (R/S) calculation. The lookback window is divided into blocks at four different sizes; within each block, returns are measured as deviations from the Kalman drift (not from a block average), the cumulative deviation range is divided by the deviations' standard deviation, and the slope of that ratio across the four block sizes (on log-log axes) is the Hurst exponent. The estimate is computed every bar but only *recorded* on confirmed bars, so the line never repaints after a bar closes. Lookback and block sizes are auto-optimised to the chart timeframe and the Kalman settings (longer Kalman adaptation and slower Q both lengthen the window), with manual override available. The information table shows the live values so you always know what the auto mode selected.
### 2.4 The FLD (Future Line of Demarcation) — the cycle timer
**What it does.** A line on the price chart showing where the dominant cycle's median sits, with markers when price crosses it.
**Why.** Regime tells you *which* game to play; the cycle tells you *when* within that game. The FLD is J.M. Hurst's tool (no relation to the Hurst exponent — an unfortunate name collision): price tends to oscillate around a cycle's midpoint, and crossing that midpoint marks the cycle turning. Used alone it is unreliable; used inside a confirmed regime it disciplines timing — a cross-up during a trend pullback is confirmation to enter, and the cycle length tells you how long a mean-reversion trade may reasonably take to come home.
**How.** The dominant cycle period is found by autocorrelation of the Kalman *innovations* — the residuals after the filter's estimate is removed, which is where cyclicality lives once drift is gone. The lag with the strongest correlation above a minimum threshold becomes the cycle period; when nothing qualifies, the previous period is kept rather than jumping between noise peaks. The FLD line then shows the Kalman estimate (or close, selectable) from half a cycle ago — the classic half-span projection. Because Pine requires a constant for true forward plotting, the line is anchored to the current bar rather than drawn into empty space to the right; the trading information is identical. Crosses of price through the FLD generate on-chart markers and alerts, and the detected period appears in the table. Manual period entry is available for instruments with a known, stable cycle.
### 2.5 The signal-quality gates — the veto layer
**What it does.** Nothing visible, most of the time. The gates can only ever *block*; they never create a setup.
**Why.** The components above measure the right things, but all measurements have moments when they are least trustworthy. Two failure modes account for most bad trades with this kind of system: trusting the filter while it is still chasing (right after a volatility shock), and entering a regime late, when the persistence or anti-persistence that justified the trade has already been harvested by earlier participants. The gates exist to refuse those moments.
**How.** Two independent vetoes, both reported in the table:
- **Gain gate.** The Kalman gain K (how much the filter moved its estimate this bar) is compared against its own rolling median. When K runs above its median, the filter is unsettled — chasing new information — and the bands and innovations are at their least reliable. Setups are blocked until K settles back below the median. This gate applies in all modes, including Custom.
- **Regime age and H-momentum.** The regime's age in bars is tracked, and setups are permitted only between a minimum age (filters one-bar threshold flickers) and a maximum age (blocks exhaustion entries — a trend regime 40 bars old on a 2-minute chart has usually already paid out). Alongside age, the 5-bar change in the Hurst reading must agree with the mode: Mean Reversion mode wants H still falling or flat; Trend Following mode wants H still rising. A regime that is already decaying does not qualify, however good its level.
Both gates can be tuned or disabled from the settings, and both are bypassed for age/momentum in Custom mode (where "regime direction" has no defined meaning).
### 2.6 The status system — pane tint, table, alerts
The lower panel communicates four states, in escalating order of attention:
| State | Pane tint | Table status | Meaning |
| --- | --- | --- | --- |
| No regime | none | No regime — stand aside | H between thresholds; the market is disorganised noise for your purposes |
| Gated | washed-out teal/orange | GATED — quality filter blocking | Your regime is live but a gate is vetoing; wait |
| Tradeable | full teal (MR) / orange (trend) | REGIME ACTIVE — setups permitted | Regime confirmed, all gates pass |
| Wrong mode | red | OPPOSITE REGIME — DO NOT TRADE | A regime exists but belongs to the other mode; swap preset or stand aside |
The red state is deliberately blunt. A live regime in the opposite style is not neutral information — it is the specific condition under which your mode loses money, and the indicator says so. Alerts fire on confirmed bars for: regime active with gates passed, regime active but gated, opposite-regime warnings, Kalman trend changes, and FLD crosses. All regime alerts can be toggled off without affecting the visuals.
---
## 3. The setups
### 3.1 A+ mean reversion (Mean Reversion mode)
**Conditions, all required:**
1. Pane tinted full teal — H below 0.40, gates passing (filter settled, regime neither newborn nor stale, H still falling or flat).
2. Kalman line flat — the filter itself sees no trend; you are not fading momentum the filter can see.
3. Price closes beyond the 2× band, ideally reaching the 3× band — a genuine excursion, not ordinary noise.
4. Cycle check: the FLD period tells you the expected rhythm; the trade should complete within roughly half a cycle.
**Entry:** the first 2-minute close back inside the 2× band — proof the excursion has been rejected, not merely hope that it will be.
**Stop:** beyond the excursion extreme (outside the 3× band side you faded).
**Target:** the Kalman estimate itself. Not beyond it — the thesis is reversion to fair value, and the estimate is fair value by construction.
**Invalidation:** H crosses up through 0.40–0.50 while in the trade (the anti-persistence premise is gone — exit regardless of price); or the excursion ages past half a cycle without reverting (the cycle premise is decaying).
### 3.2 A+ trend following (Trend Following mode)
**Conditions, all required:**
1. Pane tinted full orange — H above 0.60, gates passing.
2. Kalman line sloping cleanly in one direction, trend colour consistent.
3. Price riding between the estimate and the 1× band, never closing through the opposite band.
**Trigger:** a pullback that consolidates at the 1× band and holds above the rising estimate, followed by a close back in the trend direction. An FLD cross in the trend direction during the pullback is the strongest confirmation the system offers — regime, structure and cycle timing aligned.
**Entry:** on that confirming close.
**Stop:** the far side of the 1× band (or the far side of the estimate for a wider, swing-style stop).
**Management:** trail behind the 1× band while H holds above 0.60. When H rolls back through 0.50 — even with price still rising — stop trailing aggressively, take no new entries, and manage open risk. Persistence decay is an exit-of-regime signal, not a reversal signal.
**Invalidation:** the pane going red (the market has organised itself against your mode) or GATED persisting (the regime is live but the quality filters no longer endorse fresh risk).
### 3.3 What the indicator refuses to trade
Between the thresholds (H 0.40–0.60) the market is, for this system's purposes, noise. No tint, no permission. This is by design the most common state, and accepting it is most of the edge: the setups above are rare by construction, and the indicator's main daily output is the word "no".
---
## 4. Practical notes
**Warmup.** The Hurst line needs its lookback window (up to 192 bars on the 2-minute auto setting) before first reading; the gain gate needs ~50 bars of Kalman history before it can pass. On a fresh chart, expect the first hour of 2-minute bars to show no regime or GATED. This is intended.
**No repaint after bar close.** The Hurst reading records only on confirmed bars; regime state, gates, tints and alerts all derive from that stored value. Intrabar, the live bar's estimates update but nothing is committed until close.
**Mode swaps recalibrate.** Switching preset changes the filter's speed and therefore the auto Hurst lookback; the H line may step to a new value immediately. That is recalibration, not a fault.
**FLD caveats.** Autocorrelation is a crude cycle detector. If the table's cycle period jumps around between bars, raise the minimum correlation or switch to a manual period verified by eye. Treat the FLD as a timing overlay disciplined by the regime, never a standalone signal.
**Known structural tension.** Trend detection requires the filter to lag; mean reversion requires it to keep up. One chart cannot do both at once — hence modes. Running two instances (one per mode) and trading only when one shows a full-tint tradeable state is a legitimate way to cover both styles.
**Limits of the whole approach.** The gates assume the measurements are sound but sometimes mistimed; they fix *when to listen*, not *what you hear*. If live observation shows the H reading itself is unstable on your instrument, the honest fix is a longer Hurst window, not more filters. And no regime filter eliminates losing trades — it changes which conditions you are willing to lose in.
A complete plain-English description: what the indicator does, why, and how — followed by the trade setups it is built to serve.
---
## 1. What it is, in one paragraph
This is a regime classifier, not a signal generator. It answers three questions in order: **Where is fair value right now?** (the Kalman filter), **Is the market behaving in a way worth trading at all, and if so, in which style?** (the Hurst regime engine), and **Is right now a good moment within that regime?** (the quality gates and the FLD cycle timer). It deliberately produces no buy or sell arrows of its own. It tells you whether conditions permit a setup, and leaves the entry to you.
Everything runs from one script. The Kalman line and its bands draw on the price chart; the Hurst regime line, status table and background tints live in a separate panel below.
---
## 2. The components
### 2.1 The Kalman filter — the dynamic mean
**What it does.** Draws a single line on the price chart: the filter's running estimate of where price "should" be, given everything seen so far. Around it sit up to three pairs of bands (1×, 2×, 3×), measured in units of innovation size — the typical distance between actual price and the estimate.
**Why.** Every mean-reversion and trend concept needs a reference for "normal". A moving average is the usual choice, but a moving average is a static idea: it weights the last N bars the same way regardless of whether the market is calm or violent. The Kalman filter replaces that with an ongoing act of estimation. It carries a view of where price is, plus a measure of how confident it is in that view, and updates both every bar.
**How.** Each bar the filter performs two steps. First, *prediction*: it assumes price stays where its estimate currently is, but widens its uncertainty by an amount proportional to current volatility (the process noise, scaled by the Q multiplier). Second, *update*: it compares the new actual price against the prediction and moves the estimate towards the price by a fraction — the Kalman gain, K — that depends on how much it trusts the new observation versus its own estimate. That trust ratio is set by measurement noise (the R multiplier) against process noise (Q), both scaled by current volatility (ATR or standard deviation over the Adaptivity Lookback). High volatility with a high R makes the filter sceptical of new prices — more smoothing. High Q makes it quick to abandon its estimate — faster adaptation. The bands are built from the root-mean-square of past innovations, so they widen automatically when price has been straying far from the estimate and contract when it has been obedient.
The gain K is not discarded; it is stored and used later as a quality gate (section 2.5).
### 2.2 Setup modes — one indicator, two temperaments
**What it does.** A single dropdown — Mean Reversion, Trend Following, or Custom — that swaps the Kalman noise settings between two tested presets.
**Why.** The two trading styles need contradictory filter behaviour, and this is not a matter of preference but of mathematics. Mean reversion needs a filter that tracks price closely (fast: Q 0.08, R 1.0), so that "distance from fair value" is measured against a fair value that is itself current. Trend detection needs a filter that deliberately lags (slow: Q 0.02, R 1.4), because the regime test (section 2.3) measures the *leftover* persistence after the filter has explained what it can. If the filter follows a trend perfectly, nothing is left over and the trend regime can never register. The lag is what makes trend detection possible.
**How.** The preset overrides the R and Q multipliers (Custom mode restores manual control). Because the Hurst auto-optimisation reads the effective Q, switching mode also re-tunes the Hurst lookback automatically — slower filter, longer window. You can run two charts with different modes, or flip one chart's mode in two clicks when the tape changes character.
### 2.3 The Kalman-referenced Hurst exponent — the regime engine
**What it does.** The line in the lower panel, bounded between 0 and 1, with three reference levels: 0.40 (below = anti-persistent, mean-reverting), 0.50 (random walk), 0.60 (above = persistent, trending).
**Why.** The single most expensive trading error is applying the right technique to the wrong market state — fading a trend, or chasing a range. The Hurst exponent is a direct measurement of market character: whether price movements tend to continue (H above 0.5) or reverse (H below 0.5). But the standard Hurst calculation measures returns against a *static* average, which means a strong trend inflates the reading mechanically. This version measures each return against the Kalman filter's own implied drift at that bar — the filter's state estimate expressed as a per-bar return. In plain terms: the filter first explains as much of the movement as it can, and the Hurst line then measures the character of *what the filter could not explain*. Persistence in the leftovers is genuine persistence; mean-reversion in the leftovers is genuine mean-reversion.
**How.** A rescaled-range (R/S) calculation. The lookback window is divided into blocks at four different sizes; within each block, returns are measured as deviations from the Kalman drift (not from a block average), the cumulative deviation range is divided by the deviations' standard deviation, and the slope of that ratio across the four block sizes (on log-log axes) is the Hurst exponent. The estimate is computed every bar but only *recorded* on confirmed bars, so the line never repaints after a bar closes. Lookback and block sizes are auto-optimised to the chart timeframe and the Kalman settings (longer Kalman adaptation and slower Q both lengthen the window), with manual override available. The information table shows the live values so you always know what the auto mode selected.
### 2.4 The FLD (Future Line of Demarcation) — the cycle timer
**What it does.** A line on the price chart showing where the dominant cycle's median sits, with markers when price crosses it.
**Why.** Regime tells you *which* game to play; the cycle tells you *when* within that game. The FLD is J.M. Hurst's tool (no relation to the Hurst exponent — an unfortunate name collision): price tends to oscillate around a cycle's midpoint, and crossing that midpoint marks the cycle turning. Used alone it is unreliable; used inside a confirmed regime it disciplines timing — a cross-up during a trend pullback is confirmation to enter, and the cycle length tells you how long a mean-reversion trade may reasonably take to come home.
**How.** The dominant cycle period is found by autocorrelation of the Kalman *innovations* — the residuals after the filter's estimate is removed, which is where cyclicality lives once drift is gone. The lag with the strongest correlation above a minimum threshold becomes the cycle period; when nothing qualifies, the previous period is kept rather than jumping between noise peaks. The FLD line then shows the Kalman estimate (or close, selectable) from half a cycle ago — the classic half-span projection. Because Pine requires a constant for true forward plotting, the line is anchored to the current bar rather than drawn into empty space to the right; the trading information is identical. Crosses of price through the FLD generate on-chart markers and alerts, and the detected period appears in the table. Manual period entry is available for instruments with a known, stable cycle.
### 2.5 The signal-quality gates — the veto layer
**What it does.** Nothing visible, most of the time. The gates can only ever *block*; they never create a setup.
**Why.** The components above measure the right things, but all measurements have moments when they are least trustworthy. Two failure modes account for most bad trades with this kind of system: trusting the filter while it is still chasing (right after a volatility shock), and entering a regime late, when the persistence or anti-persistence that justified the trade has already been harvested by earlier participants. The gates exist to refuse those moments.
**How.** Two independent vetoes, both reported in the table:
- **Gain gate.** The Kalman gain K (how much the filter moved its estimate this bar) is compared against its own rolling median. When K runs above its median, the filter is unsettled — chasing new information — and the bands and innovations are at their least reliable. Setups are blocked until K settles back below the median. This gate applies in all modes, including Custom.
- **Regime age and H-momentum.** The regime's age in bars is tracked, and setups are permitted only between a minimum age (filters one-bar threshold flickers) and a maximum age (blocks exhaustion entries — a trend regime 40 bars old on a 2-minute chart has usually already paid out). Alongside age, the 5-bar change in the Hurst reading must agree with the mode: Mean Reversion mode wants H still falling or flat; Trend Following mode wants H still rising. A regime that is already decaying does not qualify, however good its level.
Both gates can be tuned or disabled from the settings, and both are bypassed for age/momentum in Custom mode (where "regime direction" has no defined meaning).
### 2.6 The status system — pane tint, table, alerts
The lower panel communicates four states, in escalating order of attention:
| State | Pane tint | Table status | Meaning |
| --- | --- | --- | --- |
| No regime | none | No regime — stand aside | H between thresholds; the market is disorganised noise for your purposes |
| Gated | washed-out teal/orange | GATED — quality filter blocking | Your regime is live but a gate is vetoing; wait |
| Tradeable | full teal (MR) / orange (trend) | REGIME ACTIVE — setups permitted | Regime confirmed, all gates pass |
| Wrong mode | red | OPPOSITE REGIME — DO NOT TRADE | A regime exists but belongs to the other mode; swap preset or stand aside |
The red state is deliberately blunt. A live regime in the opposite style is not neutral information — it is the specific condition under which your mode loses money, and the indicator says so. Alerts fire on confirmed bars for: regime active with gates passed, regime active but gated, opposite-regime warnings, Kalman trend changes, and FLD crosses. All regime alerts can be toggled off without affecting the visuals.
---
## 3. The setups
### 3.1 A+ mean reversion (Mean Reversion mode)
**Conditions, all required:**
1. Pane tinted full teal — H below 0.40, gates passing (filter settled, regime neither newborn nor stale, H still falling or flat).
2. Kalman line flat — the filter itself sees no trend; you are not fading momentum the filter can see.
3. Price closes beyond the 2× band, ideally reaching the 3× band — a genuine excursion, not ordinary noise.
4. Cycle check: the FLD period tells you the expected rhythm; the trade should complete within roughly half a cycle.
**Entry:** the first 2-minute close back inside the 2× band — proof the excursion has been rejected, not merely hope that it will be.
**Stop:** beyond the excursion extreme (outside the 3× band side you faded).
**Target:** the Kalman estimate itself. Not beyond it — the thesis is reversion to fair value, and the estimate is fair value by construction.
**Invalidation:** H crosses up through 0.40–0.50 while in the trade (the anti-persistence premise is gone — exit regardless of price); or the excursion ages past half a cycle without reverting (the cycle premise is decaying).
### 3.2 A+ trend following (Trend Following mode)
**Conditions, all required:**
1. Pane tinted full orange — H above 0.60, gates passing.
2. Kalman line sloping cleanly in one direction, trend colour consistent.
3. Price riding between the estimate and the 1× band, never closing through the opposite band.
**Trigger:** a pullback that consolidates at the 1× band and holds above the rising estimate, followed by a close back in the trend direction. An FLD cross in the trend direction during the pullback is the strongest confirmation the system offers — regime, structure and cycle timing aligned.
**Entry:** on that confirming close.
**Stop:** the far side of the 1× band (or the far side of the estimate for a wider, swing-style stop).
**Management:** trail behind the 1× band while H holds above 0.60. When H rolls back through 0.50 — even with price still rising — stop trailing aggressively, take no new entries, and manage open risk. Persistence decay is an exit-of-regime signal, not a reversal signal.
**Invalidation:** the pane going red (the market has organised itself against your mode) or GATED persisting (the regime is live but the quality filters no longer endorse fresh risk).
### 3.3 What the indicator refuses to trade
Between the thresholds (H 0.40–0.60) the market is, for this system's purposes, noise. No tint, no permission. This is by design the most common state, and accepting it is most of the edge: the setups above are rare by construction, and the indicator's main daily output is the word "no".
---
## 4. Practical notes
**Warmup.** The Hurst line needs its lookback window (up to 192 bars on the 2-minute auto setting) before first reading; the gain gate needs ~50 bars of Kalman history before it can pass. On a fresh chart, expect the first hour of 2-minute bars to show no regime or GATED. This is intended.
**No repaint after bar close.** The Hurst reading records only on confirmed bars; regime state, gates, tints and alerts all derive from that stored value. Intrabar, the live bar's estimates update but nothing is committed until close.
**Mode swaps recalibrate.** Switching preset changes the filter's speed and therefore the auto Hurst lookback; the H line may step to a new value immediately. That is recalibration, not a fault.
**FLD caveats.** Autocorrelation is a crude cycle detector. If the table's cycle period jumps around between bars, raise the minimum correlation or switch to a manual period verified by eye. Treat the FLD as a timing overlay disciplined by the regime, never a standalone signal.
**Known structural tension.** Trend detection requires the filter to lag; mean reversion requires it to keep up. One chart cannot do both at once — hence modes. Running two instances (one per mode) and trading only when one shows a full-tint tradeable state is a legitimate way to cover both styles.
**Limits of the whole approach.** The gates assume the measurements are sound but sometimes mistimed; they fix *when to listen*, not *what you hear*. If live observation shows the H reading itself is unstable on your instrument, the honest fix is a longer Hurst window, not more filters. And no regime filter eliminates losing trades — it changes which conditions you are willing to lose in.

免責聲明
這些資訊和出版物並非旨在提供,也不構成TradingView提供或認可的任何形式的財務、投資、交易或其他類型的建議或推薦。請閱讀使用條款以了解更多資訊。