已更新
XAUUSD Family Oscillator (XFO)
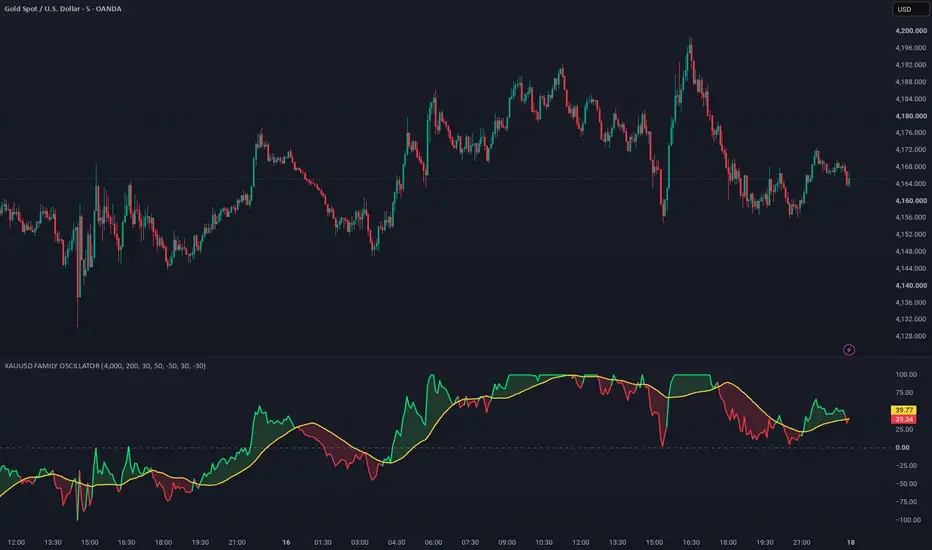
📘 XAUUSD Family Oscillator (XFO)
The XAUUSD Family Oscillator (XFO) is a technical indicator designed to visualize volatility-based momentum in the market.
It combines a volatility-adjusted channel with an oscillator and a smoothed signal line (SMA) to help traders identify potential overbought and oversold conditions, trend shifts, and strength changes in price movements.
The indicator is built around a mid-price SMA and dynamically adjusts its range based on recent candle volatility.
The oscillator reflects the position of the current price within this adaptive band, while the signal line provides a smoother trend confirmation.
Main Features:
Dynamic volatility-based oscillator.
Signal line (SMA) for trend confirmation.
Visual color change between bullish and bearish momentum.
Clean design — only oscillator and signal line shown.
Optional overbought/oversold reference levels for contextual analysis.
Disclaimer:
This indicator is for educational and analytical purposes only.
It is not financial advice and should not be used as a sole basis for investment decisions.
Always conduct your own analysis and manage risk responsibly.
The XAUUSD Family Oscillator (XFO) is a technical indicator designed to visualize volatility-based momentum in the market.
It combines a volatility-adjusted channel with an oscillator and a smoothed signal line (SMA) to help traders identify potential overbought and oversold conditions, trend shifts, and strength changes in price movements.
The indicator is built around a mid-price SMA and dynamically adjusts its range based on recent candle volatility.
The oscillator reflects the position of the current price within this adaptive band, while the signal line provides a smoother trend confirmation.
Main Features:
Dynamic volatility-based oscillator.
Signal line (SMA) for trend confirmation.
Visual color change between bullish and bearish momentum.
Clean design — only oscillator and signal line shown.
Optional overbought/oversold reference levels for contextual analysis.
Disclaimer:
This indicator is for educational and analytical purposes only.
It is not financial advice and should not be used as a sole basis for investment decisions.
Always conduct your own analysis and manage risk responsibly.
發行說明
Updated chart snapshot so the oscillator is clearly visible (5m chart).
免責聲明
這些資訊和出版物並非旨在提供,也不構成TradingView提供或認可的任何形式的財務、投資、交易或其他類型的建議或推薦。請閱讀使用條款以了解更多資訊。