OPEN-SOURCE SCRIPT
FLEE MTF Context & Range
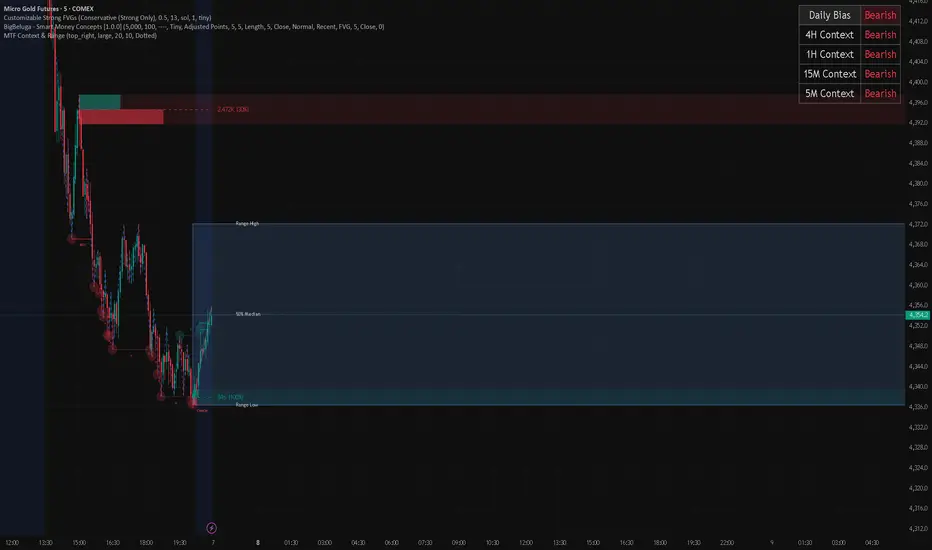
This indicator is a multi-timeframe market context tool. Its job is to help you quickly understand what the market is doing across multiple timeframes and what range price is currently trading inside.
It shows a context table in the top-right corner of the chart. That table tells you the trend direction for the 4H, 1H, 15M, and 5M timeframes. Each timeframe will show whether price is bullish, bearish, or neutral.
At the top of the table, it also shows the Daily overall bias. The daily bias is the main direction of the market, so you can quickly see whether the bigger picture is leaning bullish or bearish before taking trades on the lower timeframes.
The indicator also identifies the current range price is moving inside. When price is consolidating or trading between a high and a low, the indicator draws a transparent box around that range. The top of the box marks the range high, and the bottom marks the range low.
Inside the range box, the indicator draws a dotted 50% median line. This helps you see whether price is trading in the upper half or lower half of the range. The median can help with bias, entries, and understanding whether price is closer to premium or discount.
The indicator updates as the market moves. When a new range forms, the old range can disappear or stay depending on the settings. You can customize the colors, transparency, labels, timeframe options, and how sensitive the range detection is.
In simple words: this indicator tells you the trend on the higher and lower timeframes, gives you the daily bias, and visually marks the current price range with a 50% line so you can make cleaner trading decisions.
It shows a context table in the top-right corner of the chart. That table tells you the trend direction for the 4H, 1H, 15M, and 5M timeframes. Each timeframe will show whether price is bullish, bearish, or neutral.
At the top of the table, it also shows the Daily overall bias. The daily bias is the main direction of the market, so you can quickly see whether the bigger picture is leaning bullish or bearish before taking trades on the lower timeframes.
The indicator also identifies the current range price is moving inside. When price is consolidating or trading between a high and a low, the indicator draws a transparent box around that range. The top of the box marks the range high, and the bottom marks the range low.
Inside the range box, the indicator draws a dotted 50% median line. This helps you see whether price is trading in the upper half or lower half of the range. The median can help with bias, entries, and understanding whether price is closer to premium or discount.
The indicator updates as the market moves. When a new range forms, the old range can disappear or stay depending on the settings. You can customize the colors, transparency, labels, timeframe options, and how sensitive the range detection is.
In simple words: this indicator tells you the trend on the higher and lower timeframes, gives you the daily bias, and visually marks the current price range with a 50% line so you can make cleaner trading decisions.
開源腳本
秉持TradingView一貫精神,這個腳本的創作者將其設為開源,以便交易者檢視並驗證其功能。向作者致敬!您可以免費使用此腳本,但請注意,重新發佈代碼需遵守我們的社群規範。

免責聲明
這些資訊和出版物並非旨在提供,也不構成TradingView提供或認可的任何形式的財務、投資、交易或其他類型的建議或推薦。請閱讀使用條款以了解更多資訊。
免責聲明
這些資訊和出版物並非旨在提供,也不構成TradingView提供或認可的任何形式的財務、投資、交易或其他類型的建議或推薦。請閱讀使用條款以了解更多資訊。