OPEN-SOURCE SCRIPT
已更新 NeuPortal Market Compass - Empirical Bands, Regime & Indices
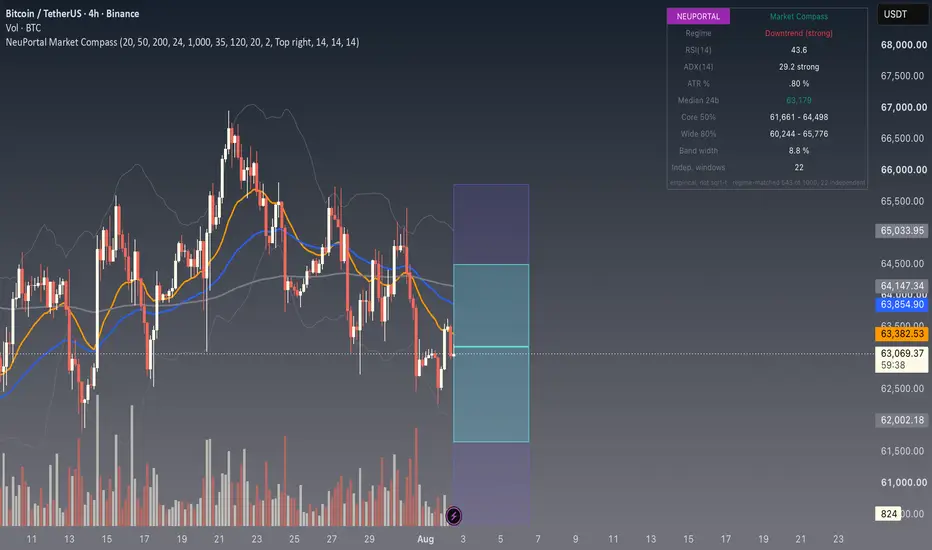
NeuPortal Market Compass is a single overlay that instruments any symbol on any timeframe with three layers of context plus a readout dashboard, so you get the useful curves, the envelope, a forward band and the key indices from one indicator instead of stacking five.
WHAT IT DRAWS
1) Trend curves. EMA fast / mid / slow (20 / 50 / 200 by default) and an optional VWAP. The classic structure read at a glance.
2) Volatility envelope. A standard Bollinger band (20, 2 by default) for immediate context on how stretched price is right now.
3) Empirical forecast band. This is the part that is different. Instead of a sigma*sqrt(t) projection, it reads the distribution of the chart's OWN realised H-bar moves over the history window and takes quantiles from it: a core 50% zone (25th to 75th percentile), a wide 80% zone (10th to 90th) and the median, all projected forward H bars into empty space to the right of the last candle.
Why empirical rather than parametric: real markets have fat tails and volatility clustering, so a normal, independent-returns assumption misprices the interval - and it does so in different directions at different horizons. Reading the quantiles straight from history avoids that assumption entirely. The band is only as trustworthy as the sample behind it, so the dashboard prints the number of INDEPENDENT windows (history window / horizon), not the inflated overlapping count.
DASHBOARD (top-right, movable)
- Regime: trend direction from the EMAs, with strength gated by ADX
- RSI, ADX, ATR% - momentum, trend strength and volatility at a glance
- Median, Core 50% and Wide 80% band edges for the chosen horizon
- Band width as a percent of price - how much the market itself says it can move
- Independent windows behind the band - the honest sample size
HOW TO USE
Set the Horizon to how many bars ahead you care about and the History window to how much past data feeds the distribution. Watch coverage over time: across many bars, price should sit inside the 50% core about half the time and inside the 80% band about eighty percent of the time. A band that contains price far more often than that is padded; far less often is overconfident. Both are information.
SETTINGS
Toggle each layer independently (EMAs, VWAP, Bollinger, band, dashboard), set all lengths, recolour the zones, move the dashboard, and optionally tint the background
WHAT IT DRAWS
1) Trend curves. EMA fast / mid / slow (20 / 50 / 200 by default) and an optional VWAP. The classic structure read at a glance.
2) Volatility envelope. A standard Bollinger band (20, 2 by default) for immediate context on how stretched price is right now.
3) Empirical forecast band. This is the part that is different. Instead of a sigma*sqrt(t) projection, it reads the distribution of the chart's OWN realised H-bar moves over the history window and takes quantiles from it: a core 50% zone (25th to 75th percentile), a wide 80% zone (10th to 90th) and the median, all projected forward H bars into empty space to the right of the last candle.
Why empirical rather than parametric: real markets have fat tails and volatility clustering, so a normal, independent-returns assumption misprices the interval - and it does so in different directions at different horizons. Reading the quantiles straight from history avoids that assumption entirely. The band is only as trustworthy as the sample behind it, so the dashboard prints the number of INDEPENDENT windows (history window / horizon), not the inflated overlapping count.
DASHBOARD (top-right, movable)
- Regime: trend direction from the EMAs, with strength gated by ADX
- RSI, ADX, ATR% - momentum, trend strength and volatility at a glance
- Median, Core 50% and Wide 80% band edges for the chosen horizon
- Band width as a percent of price - how much the market itself says it can move
- Independent windows behind the band - the honest sample size
HOW TO USE
Set the Horizon to how many bars ahead you care about and the History window to how much past data feeds the distribution. Watch coverage over time: across many bars, price should sit inside the 50% core about half the time and inside the 80% band about eighty percent of the time. A band that contains price far more often than that is padded; far less often is overconfident. Both are information.
SETTINGS
Toggle each layer independently (EMAs, VWAP, Bollinger, band, dashboard), set all lengths, recolour the zones, move the dashboard, and optionally tint the background
發行說明
Added regime conditioning to the empirical band.The band now uses only historical windows whose volatility AT THE WINDOW'S OPEN was within 35% of
today's. Measuring at the close would select windows partly on what happened inside them, which
leaks the outcome into the sample.
Falls back to the unconditional sample below 120 surviving windows - a conditional estimate on 30
observations is worse than an unconditional one on 3,000. The dashboard now states which sample
produced the band: regime-matched N of M, and the independent count.
Why: our own out-of-sample coverage was running 86% inside stated 50% zones. Too wide is a failure
in the same way too narrow is.
發行說明
Fixes a runtime error and refreshes the chart snapshot.The regime-matching loop runs only on the last bar, so Pine never saw a deep historical reference while sizing the series buffer during the first bars. It allocated the default, and the loop then died with "The requested historical offset (557) is beyond the historical buffer's limit (556)" - an off-by-one against a buffer that was never told how far back this script actually reaches. Declaring max_bars_back = 5000 up front resolves it, matching what NeuPortal Empirical Range already uses for the same reason.
No change to the calculation, the inputs or the dashboard. The bands, the regime readings and the independent-window count are identical.
The previous chart snapshot had several indicators stacked on one chart with overlapping tables, which made the output impossible to read. This one shows the indicator alone.
開源腳本
秉持TradingView一貫精神,這個腳本的創作者將其設為開源,以便交易者檢視並驗證其功能。向作者致敬!您可以免費使用此腳本,但請注意,重新發佈代碼需遵守我們的社群規範。

免責聲明
這些資訊和出版物並非旨在提供,也不構成TradingView提供或認可的任何形式的財務、投資、交易或其他類型的建議或推薦。請閱讀使用條款以了解更多資訊。
免責聲明
這些資訊和出版物並非旨在提供,也不構成TradingView提供或認可的任何形式的財務、投資、交易或其他類型的建議或推薦。請閱讀使用條款以了解更多資訊。