OPEN-SOURCE SCRIPT
Normalized Coefficient of Variation
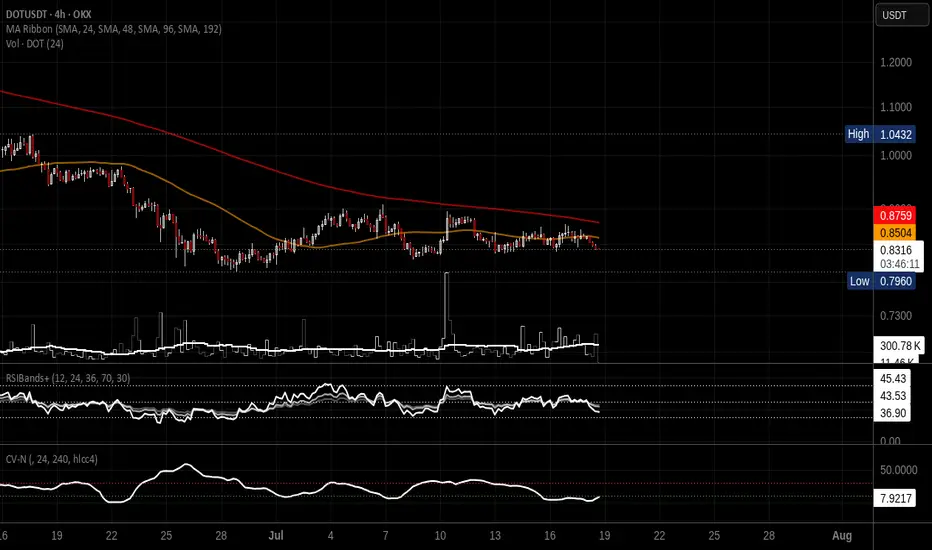
# Normalized Coefficient of Variation (CV)
This indicator measures market volatility using the **Coefficient of Variation (CV)**, defined as the ratio of the standard deviation to the simple moving average (SMA), expressed as a percentage.
Unlike the traditional CV, which has no upper limit and can vary significantly across different assets and market conditions, this indicator applies a **Rolling Min-Max Normalization** over a user-defined lookback period. The result is a dynamic oscillator scaled between **0 and 100**, making it easier to compare relative volatility across different symbols and timeframes.
## Formula
**Coefficient of Variation**
CV = (Standard Deviation / SMA) × 100
**Normalization**
Normalized CV = 100 × (CV − Lowest CV) / (Highest CV − Lowest CV)
where the lowest and highest CV values are calculated over the selected normalization lookback period.
## Features
* Rolling Min-Max normalization (0-100 scale)
* User-selectable calculation timeframe
* Adjustable CV period (default: 24)
* Adjustable normalization lookback (default: 250)
* Uses Simple Moving Average (SMA)
* White oscillator line for clear visualization
* Dotted reference levels at 10 and 30
* Hidden raw CV value available in the Data Window
## Interpretation
* Values below **10** indicate relatively low volatility compared to recent history.
* Values above **30** indicate relatively high volatility compared to recent history.
* Values approaching **100** represent the highest relative volatility observed within the selected normalization window.
* Values approaching **0** represent the lowest relative volatility observed within the selected normalization window.
Because the indicator is normalized, the displayed values represent **relative volatility within the selected lookback period**, not the absolute Coefficient of Variation percentage. This makes the indicator especially useful for comparing changing volatility regimes across different markets and timeframes.
This indicator is intended as a volatility analysis tool and should be used alongside price action and other technical indicators rather than as a standalone trading signal.
This indicator measures market volatility using the **Coefficient of Variation (CV)**, defined as the ratio of the standard deviation to the simple moving average (SMA), expressed as a percentage.
Unlike the traditional CV, which has no upper limit and can vary significantly across different assets and market conditions, this indicator applies a **Rolling Min-Max Normalization** over a user-defined lookback period. The result is a dynamic oscillator scaled between **0 and 100**, making it easier to compare relative volatility across different symbols and timeframes.
## Formula
**Coefficient of Variation**
CV = (Standard Deviation / SMA) × 100
**Normalization**
Normalized CV = 100 × (CV − Lowest CV) / (Highest CV − Lowest CV)
where the lowest and highest CV values are calculated over the selected normalization lookback period.
## Features
* Rolling Min-Max normalization (0-100 scale)
* User-selectable calculation timeframe
* Adjustable CV period (default: 24)
* Adjustable normalization lookback (default: 250)
* Uses Simple Moving Average (SMA)
* White oscillator line for clear visualization
* Dotted reference levels at 10 and 30
* Hidden raw CV value available in the Data Window
## Interpretation
* Values below **10** indicate relatively low volatility compared to recent history.
* Values above **30** indicate relatively high volatility compared to recent history.
* Values approaching **100** represent the highest relative volatility observed within the selected normalization window.
* Values approaching **0** represent the lowest relative volatility observed within the selected normalization window.
Because the indicator is normalized, the displayed values represent **relative volatility within the selected lookback period**, not the absolute Coefficient of Variation percentage. This makes the indicator especially useful for comparing changing volatility regimes across different markets and timeframes.
This indicator is intended as a volatility analysis tool and should be used alongside price action and other technical indicators rather than as a standalone trading signal.
開源腳本
秉持TradingView一貫精神,這個腳本的創作者將其設為開源,以便交易者檢視並驗證其功能。向作者致敬!您可以免費使用此腳本,但請注意,重新發佈代碼需遵守我們的社群規範。

免責聲明
這些資訊和出版物並非旨在提供,也不構成TradingView提供或認可的任何形式的財務、投資、交易或其他類型的建議或推薦。請閱讀使用條款以了解更多資訊。
免責聲明
這些資訊和出版物並非旨在提供,也不構成TradingView提供或認可的任何形式的財務、投資、交易或其他類型的建議或推薦。請閱讀使用條款以了解更多資訊。