OPEN-SOURCE SCRIPT
BankNifty Contribution Dashboard
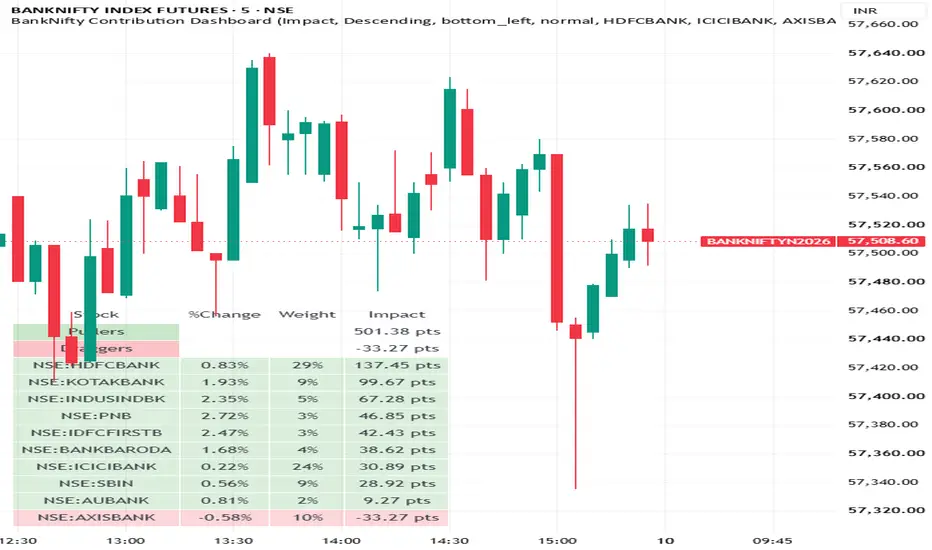
BankNifty Contribution Dashboard – Brief
The BankNifty Contribution Dashboard is a TradingView Pine Script indicator designed to identify which constituent banks are driving or dragging the Bank Nifty index in real time. Instead of simply displaying percentage price changes, the indicator calculates the actual point contribution of each stock to the Bank Nifty based on its assigned index weight, helping traders understand the true source of index movement.
Key Features
Tracks Top 10 Bank Nifty Constituents
HDFC Bank
ICICI Bank
Axis Bank
Kotak Mahindra Bank
State Bank of India
IndusInd Bank
Bank of Baroda
Punjab National Bank
IDFC First Bank
AU Small Finance Bank
Calculates Real-Time Daily Performance
Compares each stock's current price with the previous day's close.
Displays the daily percentage change for every constituent.
Weighted Index Contribution
Uses customizable Bank Nifty weightages for each stock.
Converts percentage movement into actual Bank Nifty points contributed.
Shows which stocks have the greatest influence on the index.
Pullers vs Draggers Analysis
Calculates the total positive contribution (Pullers).
Calculates the total negative contribution (Draggers).
Provides an instant view of overall market strength and weakness.
Dynamic Sorting
Sort stocks by:
Contribution Impact (points)
Percentage Change
Supports both Ascending and Descending order.
Customizable Dashboard
Adjustable table position.
Custom text size.
User-defined text colors.
Separate colors for positive (Pullers) and negative (Draggers).
Dashboard Information
The table displays:
Column Description
Stock Constituent bank name
% Change Daily percentage movement
Weight Assigned Bank Nifty weight
Impact Actual Bank Nifty points contributed
The dashboard also summarizes:
Total Pullers (positive index contribution)
Total Draggers (negative index contribution)
Impact Calculation
The contribution of each stock is calculated using the formula:
Impact = Bank Nifty Value × Stock Weight × Daily Percentage Change
This converts a stock's percentage movement into its approximate contribution in Bank Nifty index points.
Benefits for Traders
Instantly identify which banks are moving the index.
Distinguish genuine index strength from movements driven by a few heavyweight stocks.
Monitor sector leadership during market hours.
Confirm breakout and breakdown moves by checking constituent participation.
Improve intraday trading decisions using component-level market breadth.
Ideal Users
Bank Nifty Intraday Traders
Index Option Traders
Futures Traders
Swing Traders
Institutional Market Analysts
Technical Analysts monitoring index participation
Summary
The BankNifty Contribution Dashboard transforms raw price data into a practical market analysis tool by revealing the real contributors behind every Bank Nifty move. By combining constituent weightages with live price changes, it provides traders with a clear, sortable dashboard that highlights market leaders, laggards, and the overall strength of the banking index at a glance.
The BankNifty Contribution Dashboard is a TradingView Pine Script indicator designed to identify which constituent banks are driving or dragging the Bank Nifty index in real time. Instead of simply displaying percentage price changes, the indicator calculates the actual point contribution of each stock to the Bank Nifty based on its assigned index weight, helping traders understand the true source of index movement.
Key Features
Tracks Top 10 Bank Nifty Constituents
HDFC Bank
ICICI Bank
Axis Bank
Kotak Mahindra Bank
State Bank of India
IndusInd Bank
Bank of Baroda
Punjab National Bank
IDFC First Bank
AU Small Finance Bank
Calculates Real-Time Daily Performance
Compares each stock's current price with the previous day's close.
Displays the daily percentage change for every constituent.
Weighted Index Contribution
Uses customizable Bank Nifty weightages for each stock.
Converts percentage movement into actual Bank Nifty points contributed.
Shows which stocks have the greatest influence on the index.
Pullers vs Draggers Analysis
Calculates the total positive contribution (Pullers).
Calculates the total negative contribution (Draggers).
Provides an instant view of overall market strength and weakness.
Dynamic Sorting
Sort stocks by:
Contribution Impact (points)
Percentage Change
Supports both Ascending and Descending order.
Customizable Dashboard
Adjustable table position.
Custom text size.
User-defined text colors.
Separate colors for positive (Pullers) and negative (Draggers).
Dashboard Information
The table displays:
Column Description
Stock Constituent bank name
% Change Daily percentage movement
Weight Assigned Bank Nifty weight
Impact Actual Bank Nifty points contributed
The dashboard also summarizes:
Total Pullers (positive index contribution)
Total Draggers (negative index contribution)
Impact Calculation
The contribution of each stock is calculated using the formula:
Impact = Bank Nifty Value × Stock Weight × Daily Percentage Change
This converts a stock's percentage movement into its approximate contribution in Bank Nifty index points.
Benefits for Traders
Instantly identify which banks are moving the index.
Distinguish genuine index strength from movements driven by a few heavyweight stocks.
Monitor sector leadership during market hours.
Confirm breakout and breakdown moves by checking constituent participation.
Improve intraday trading decisions using component-level market breadth.
Ideal Users
Bank Nifty Intraday Traders
Index Option Traders
Futures Traders
Swing Traders
Institutional Market Analysts
Technical Analysts monitoring index participation
Summary
The BankNifty Contribution Dashboard transforms raw price data into a practical market analysis tool by revealing the real contributors behind every Bank Nifty move. By combining constituent weightages with live price changes, it provides traders with a clear, sortable dashboard that highlights market leaders, laggards, and the overall strength of the banking index at a glance.
開源腳本
秉持TradingView一貫精神,這個腳本的創作者將其設為開源,以便交易者檢視並驗證其功能。向作者致敬!您可以免費使用此腳本,但請注意,重新發佈代碼需遵守我們的社群規範。

免責聲明
這些資訊和出版物並非旨在提供,也不構成TradingView提供或認可的任何形式的財務、投資、交易或其他類型的建議或推薦。請閱讀使用條款以了解更多資訊。
開源腳本
秉持TradingView一貫精神,這個腳本的創作者將其設為開源,以便交易者檢視並驗證其功能。向作者致敬!您可以免費使用此腳本,但請注意,重新發佈代碼需遵守我們的社群規範。
免責聲明
這些資訊和出版物並非旨在提供,也不構成TradingView提供或認可的任何形式的財務、投資、交易或其他類型的建議或推薦。請閱讀使用條款以了解更多資訊。