OPEN-SOURCE SCRIPT
CISD Pro+ | Cross-Symbol Correlation]
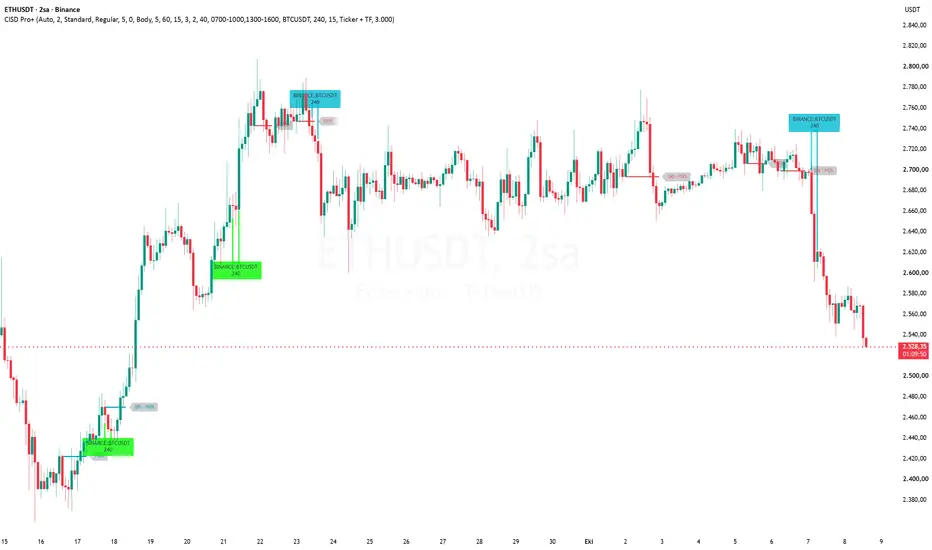
📘 CISD Pro+ | Cross-Symbol Correlation
"CISD Pro+ | Cross-Symbol Correlation" finds CISD signals on the chart; draws the CISDs of a second product you select (e.g., ETH, DXY) as hook shapes next to them, and measures the momentum alignment of the two products, weighting the signal's probability and quality accordingly.
Short name: CISD Pro+
What it does: Finds CISD signals on the chart, measures their correlation with another symbol you select, and scores the signals based on this alignment. In short: it answers the question "Is this signal moving in the same direction as the other product I'm watching?"
────────────────────────────────────────
🎯 1. What Does This Indicator Do?
- Automatically finds CISD (Change In State of Delivery) points.
In other words, it marks the bars where the market changes direction and the buyer/seller balance is broken.
- With MTF (Multi-Timeframe), it also searches for CISD on higher timeframes simultaneously.
- With Symbol CISD, it pulls data from another instrument (e.g., on an ETHUSDT chart, BTCUSDT, DXY, SPX, etc.).
- Measures Correlation & Momentum Alignment: Is the symbol on the chart moving in the same direction as the other symbol you selected?
- With Bayesian & GARCH, it assigns a probability (P) and quality (Q) score to the signal.
- Draws Fibonacci extensions for target levels.
────────────────────────────────────────
⚙️ 3. What Do the Settings Mean?
1. ⚙️ General
- CISD Directional Bias: Should we catch only bullish, only bearish, or both? "Auto" = both.
- Debug Mode: Something wrong? Turn it on, it writes what happened in the log panel. Keep it off normally.
2. 🔥 CISD Detection
- Show CISD: Main on/off switch.
- CISD Sensitivity: "Standard" = waits 10 bars, "Max" = waits 20 bars. Choose "Max" in slow markets.
- CISD Size Filter: Filters out very small, insignificant signals. If you choose "Juicy", it only shows large moves.
- Show All Historical CISD?: If on, invalidated signals remain as dashed lines.
- Filter by Purge: Shows only signals with a liquidity purge.
- 🔒 One Label Per Level: Deletes the old one so labels don't pile up at the same price level.
2.2 🧪 Fibonacci (Targets)
You can turn Fibonacci extensions like -0.5, -2, -2.5, -4, -4.5 on and off here.
Calculate From → "Body" or "Wick" selection. Generally "Body" works cleaner.
3. 🕐 MTF CISD (Higher Timeframe)
- Enable MTF CISD: Also searches for signals on higher timeframes.
- MTF Timeframe: Which timeframe? e.g., 60 = 1 hour, 240 = 4 hours, D = daily.
- Max MTF CISDs: How many signals to keep in the same direction.
- MTF Pending Timeout: How many higher-TF bars a signal should wait for confirmation.
4. 🧠 Advanced Analytics
- Enable Advanced Analytics: Turns on quality (Q) and probability (P) scores.
- GARCH Dynamic Sizing: Automatically adjusts the threshold when the market is calm/volatile.
- Chart CISD Filter (Quality): Minimum quality score. 40 = medium, 60 = strict, 20 = loose.
- Bayesian Weighting: Turns on probability calculation (purge, MTF, volume, killzone effect).
- Killzone Session: Busy hours bonus. e.g., 0700-1000,1300-1600.
5. 📊 Symbol CISD (⭐ Most Important Part)
This section is where correlation with another product is measured.
- Enable Symbol CISD: Turns it on.
- Symbol: The instrument you want to compare. e.g., BINANCE:ETHUSDT, TVC:DXY, SP:SPX.
- Timeframe: Leave empty = same as chart. Or select like 60, D.
- U Bull / U Bear: Colors of the correlation mark (hook-shaped drawing).
- 🏷️ Label Mode: Should text appear below? Options like "TF Only" (timeframe only), "Ticker + TF" (symbol + timeframe).
────────────────────────────────────────
🔗 4. How Does the Correlation Feature Work?
The indicator measures correlation/alignment in two places:
1. Momentum alignment:
Is the direction of the last 10 bars on the chart the same as the direction of the last 10 bars of the symbol you selected?
- Same direction → strong alignment
- Different direction → weak alignment
2. Probability model bonus:
If the two products are moving in the same direction, an extra confidence score is added to the signal. So a "correlated signal" gets a higher probability.
3. Symbol CISD engine:
When a CISD forms on the symbol you selected, a U (hook) shape is drawn on the chart. This means "there was also a reversal on the other side."
So in practice:
- You're on a BTC chart, you selected ETH → If a CISD appeared on ETH and a CISD also appeared on BTC, it means there is two-sided correlation confirmation.
- This means the signal is more reliable.
────────────────────────────────────────
📖 5. What Will You See on the Screen?
- Solid line (green/red) → Confirmed CISD
- Dotted line → CISD still waiting for confirmation
- Dashed line → Invalidated CISD (in exhaustive mode)
- 🔵 Small circle → CISD confirmation mark
- Q45 · P62% → Quality 45, probability 62%
- U (hook) shape → CISD on the selected symbol (correlation signal)
- Fibonacci lines → Target levels (-0.5, -2, -2.5, -4, -4.5)
- MTF label → Like 60 · Q72 · P78% – higher timeframe CISD
────────────────────────────────────────
🚀 6. Quick Start (5 Minutes)
1. To see only chart CISD:
Show CISD ✅ on, Enable MTF ❌ off, Enable Symbol CISD ❌ off.
2. To use MTF + Correlation together:
Enable MTF ✅, Enable Symbol CISD ✅, Symbol = BINANCE:ETHUSDT (or whatever you want to compare).
3. To see only high-quality signals:
Quality Threshold = 60, Size Filter = Juicy, MTF + Symbol CISD = ✅.
4. To see Fib targets:
Show Fibonacci Projections = ✅, tick the levels you want.
────────────────────────────────────────
💡 7. Practical Tips
- Choose a correlated asset: BTC ↔ ETH, SPX ↔ NDX, XAU ↔ DXY, etc. Don't pick a random symbol.
- Use the same timeframe: If the chart is 15m, set Symbol TF to 15m or 60. If you choose D, it works with a delay.
- If you don't want a crowded chart: Reduce Max MTF CISDs and Max Symbol CISDs to 5–8.
- When Debug is on: You'll see lines like "PIVOT-H", "PEND-BEAR", "SUMMARY" in the log panel. Useful for understanding issues.
- Red warning: If the market is very calm, CISD may not appear. Try Sensitivity = Max and Size Filter = Small.
────────────────────────────────────────
❓ 8. Frequently Asked Questions
Q: Why am I not getting any signals?
A: Show CISD might be off, the Bias filter might be one-directional, or the Size Filter might be too strict.
Q: Symbol CISD lines are not visible?
A: Enable Symbol CISD is off or the symbol name entered is incorrect. Use the full format like BINANCE:BTCUSDT.
Q: Why are MTF lines delayed?
A: MTF signals wait for the higher TF close. If you chose 60, it updates once an hour.
Q: What are Q and P?
A: Q = Quality (0–100): How solid the signal is. P = Probability (%): Chance of confirmation.
Q: Where is the correlation written?
A: It is not written as a direct number. Its effect appears in two places:
1. The P (probability) score increases if there is alignment.
2. When a CISD occurs on the selected symbol, a U-shaped hook appears on the chart.
────────────────────────────────────────
📌 9. One-Sentence Summary
"CISD Pro+ | Cross-Symbol Correlation" finds CISD signals on the chart; draws the CISDs of a second product you select (e.g., ETH, DXY) as hook shapes next to them, and measures the momentum alignment of the two products, weighting the signal's probability and quality accordingly.
────────────────────────────────────────
This indicator is adapted from the CISD code written by @cephxs.
"CISD Pro+ | Cross-Symbol Correlation" finds CISD signals on the chart; draws the CISDs of a second product you select (e.g., ETH, DXY) as hook shapes next to them, and measures the momentum alignment of the two products, weighting the signal's probability and quality accordingly.
Short name: CISD Pro+
What it does: Finds CISD signals on the chart, measures their correlation with another symbol you select, and scores the signals based on this alignment. In short: it answers the question "Is this signal moving in the same direction as the other product I'm watching?"
────────────────────────────────────────
🎯 1. What Does This Indicator Do?
- Automatically finds CISD (Change In State of Delivery) points.
In other words, it marks the bars where the market changes direction and the buyer/seller balance is broken.
- With MTF (Multi-Timeframe), it also searches for CISD on higher timeframes simultaneously.
- With Symbol CISD, it pulls data from another instrument (e.g., on an ETHUSDT chart, BTCUSDT, DXY, SPX, etc.).
- Measures Correlation & Momentum Alignment: Is the symbol on the chart moving in the same direction as the other symbol you selected?
- With Bayesian & GARCH, it assigns a probability (P) and quality (Q) score to the signal.
- Draws Fibonacci extensions for target levels.
────────────────────────────────────────
⚙️ 3. What Do the Settings Mean?
1. ⚙️ General
- CISD Directional Bias: Should we catch only bullish, only bearish, or both? "Auto" = both.
- Debug Mode: Something wrong? Turn it on, it writes what happened in the log panel. Keep it off normally.
2. 🔥 CISD Detection
- Show CISD: Main on/off switch.
- CISD Sensitivity: "Standard" = waits 10 bars, "Max" = waits 20 bars. Choose "Max" in slow markets.
- CISD Size Filter: Filters out very small, insignificant signals. If you choose "Juicy", it only shows large moves.
- Show All Historical CISD?: If on, invalidated signals remain as dashed lines.
- Filter by Purge: Shows only signals with a liquidity purge.
- 🔒 One Label Per Level: Deletes the old one so labels don't pile up at the same price level.
2.2 🧪 Fibonacci (Targets)
You can turn Fibonacci extensions like -0.5, -2, -2.5, -4, -4.5 on and off here.
Calculate From → "Body" or "Wick" selection. Generally "Body" works cleaner.
3. 🕐 MTF CISD (Higher Timeframe)
- Enable MTF CISD: Also searches for signals on higher timeframes.
- MTF Timeframe: Which timeframe? e.g., 60 = 1 hour, 240 = 4 hours, D = daily.
- Max MTF CISDs: How many signals to keep in the same direction.
- MTF Pending Timeout: How many higher-TF bars a signal should wait for confirmation.
4. 🧠 Advanced Analytics
- Enable Advanced Analytics: Turns on quality (Q) and probability (P) scores.
- GARCH Dynamic Sizing: Automatically adjusts the threshold when the market is calm/volatile.
- Chart CISD Filter (Quality): Minimum quality score. 40 = medium, 60 = strict, 20 = loose.
- Bayesian Weighting: Turns on probability calculation (purge, MTF, volume, killzone effect).
- Killzone Session: Busy hours bonus. e.g., 0700-1000,1300-1600.
5. 📊 Symbol CISD (⭐ Most Important Part)
This section is where correlation with another product is measured.
- Enable Symbol CISD: Turns it on.
- Symbol: The instrument you want to compare. e.g., BINANCE:ETHUSDT, TVC:DXY, SP:SPX.
- Timeframe: Leave empty = same as chart. Or select like 60, D.
- U Bull / U Bear: Colors of the correlation mark (hook-shaped drawing).
- 🏷️ Label Mode: Should text appear below? Options like "TF Only" (timeframe only), "Ticker + TF" (symbol + timeframe).
────────────────────────────────────────
🔗 4. How Does the Correlation Feature Work?
The indicator measures correlation/alignment in two places:
1. Momentum alignment:
Is the direction of the last 10 bars on the chart the same as the direction of the last 10 bars of the symbol you selected?
- Same direction → strong alignment
- Different direction → weak alignment
2. Probability model bonus:
If the two products are moving in the same direction, an extra confidence score is added to the signal. So a "correlated signal" gets a higher probability.
3. Symbol CISD engine:
When a CISD forms on the symbol you selected, a U (hook) shape is drawn on the chart. This means "there was also a reversal on the other side."
So in practice:
- You're on a BTC chart, you selected ETH → If a CISD appeared on ETH and a CISD also appeared on BTC, it means there is two-sided correlation confirmation.
- This means the signal is more reliable.
────────────────────────────────────────
📖 5. What Will You See on the Screen?
- Solid line (green/red) → Confirmed CISD
- Dotted line → CISD still waiting for confirmation
- Dashed line → Invalidated CISD (in exhaustive mode)
- 🔵 Small circle → CISD confirmation mark
- Q45 · P62% → Quality 45, probability 62%
- U (hook) shape → CISD on the selected symbol (correlation signal)
- Fibonacci lines → Target levels (-0.5, -2, -2.5, -4, -4.5)
- MTF label → Like 60 · Q72 · P78% – higher timeframe CISD
────────────────────────────────────────
🚀 6. Quick Start (5 Minutes)
1. To see only chart CISD:
Show CISD ✅ on, Enable MTF ❌ off, Enable Symbol CISD ❌ off.
2. To use MTF + Correlation together:
Enable MTF ✅, Enable Symbol CISD ✅, Symbol = BINANCE:ETHUSDT (or whatever you want to compare).
3. To see only high-quality signals:
Quality Threshold = 60, Size Filter = Juicy, MTF + Symbol CISD = ✅.
4. To see Fib targets:
Show Fibonacci Projections = ✅, tick the levels you want.
────────────────────────────────────────
💡 7. Practical Tips
- Choose a correlated asset: BTC ↔ ETH, SPX ↔ NDX, XAU ↔ DXY, etc. Don't pick a random symbol.
- Use the same timeframe: If the chart is 15m, set Symbol TF to 15m or 60. If you choose D, it works with a delay.
- If you don't want a crowded chart: Reduce Max MTF CISDs and Max Symbol CISDs to 5–8.
- When Debug is on: You'll see lines like "PIVOT-H", "PEND-BEAR", "SUMMARY" in the log panel. Useful for understanding issues.
- Red warning: If the market is very calm, CISD may not appear. Try Sensitivity = Max and Size Filter = Small.
────────────────────────────────────────
❓ 8. Frequently Asked Questions
Q: Why am I not getting any signals?
A: Show CISD might be off, the Bias filter might be one-directional, or the Size Filter might be too strict.
Q: Symbol CISD lines are not visible?
A: Enable Symbol CISD is off or the symbol name entered is incorrect. Use the full format like BINANCE:BTCUSDT.
Q: Why are MTF lines delayed?
A: MTF signals wait for the higher TF close. If you chose 60, it updates once an hour.
Q: What are Q and P?
A: Q = Quality (0–100): How solid the signal is. P = Probability (%): Chance of confirmation.
Q: Where is the correlation written?
A: It is not written as a direct number. Its effect appears in two places:
1. The P (probability) score increases if there is alignment.
2. When a CISD occurs on the selected symbol, a U-shaped hook appears on the chart.
────────────────────────────────────────
📌 9. One-Sentence Summary
"CISD Pro+ | Cross-Symbol Correlation" finds CISD signals on the chart; draws the CISDs of a second product you select (e.g., ETH, DXY) as hook shapes next to them, and measures the momentum alignment of the two products, weighting the signal's probability and quality accordingly.
────────────────────────────────────────
This indicator is adapted from the CISD code written by @cephxs.
開源腳本
秉持TradingView一貫精神,這個腳本的創作者將其設為開源,以便交易者檢視並驗證其功能。向作者致敬!您可以免費使用此腳本,但請注意,重新發佈代碼需遵守我們的社群規範。

免責聲明
這些資訊和出版物並非旨在提供,也不構成TradingView提供或認可的任何形式的財務、投資、交易或其他類型的建議或推薦。請閱讀使用條款以了解更多資訊。
免責聲明
這些資訊和出版物並非旨在提供,也不構成TradingView提供或認可的任何形式的財務、投資、交易或其他類型的建議或推薦。請閱讀使用條款以了解更多資訊。